- Home >
- Stock Photos >
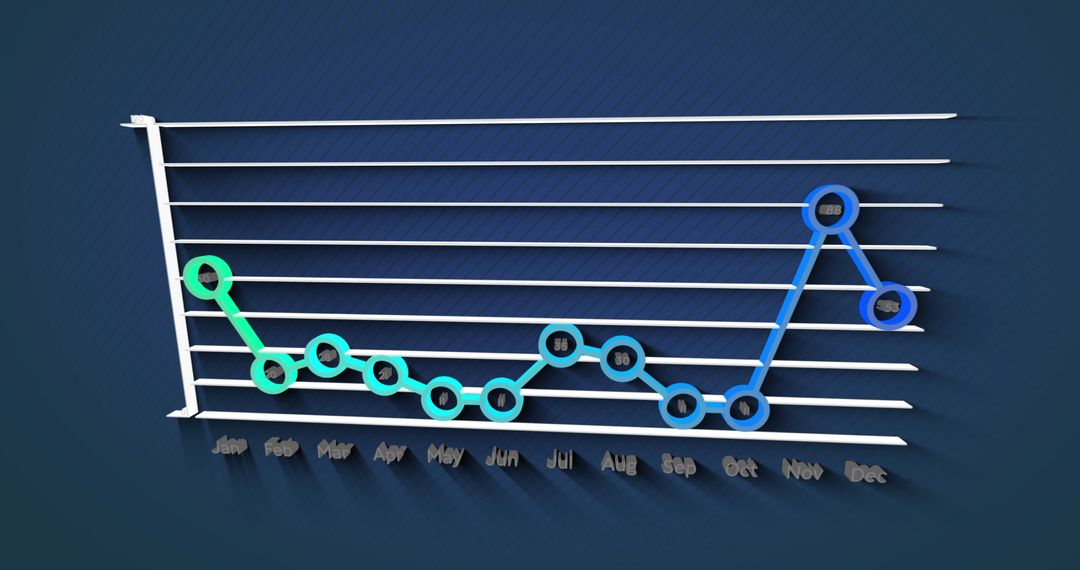
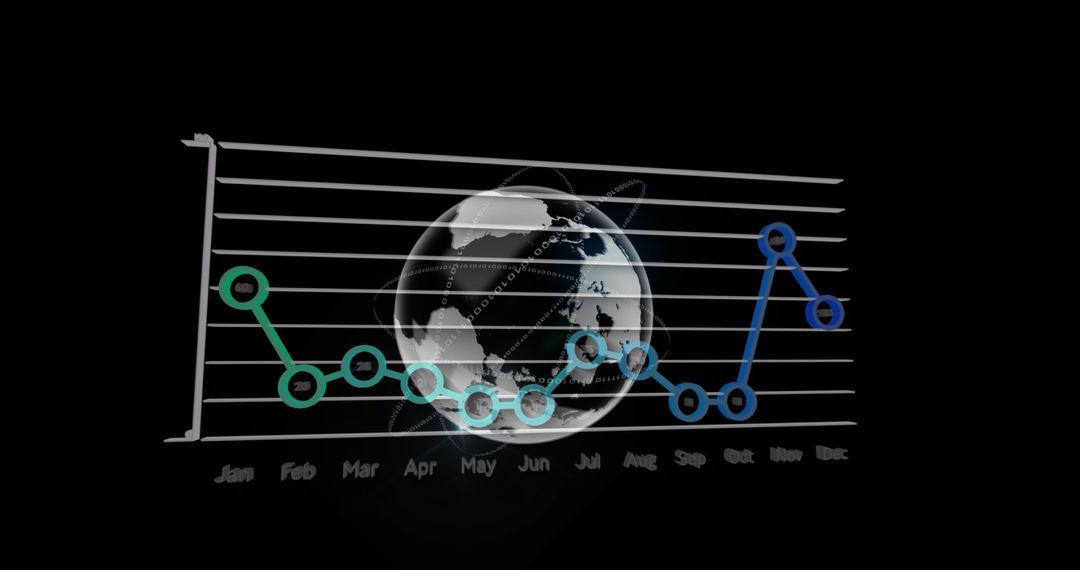
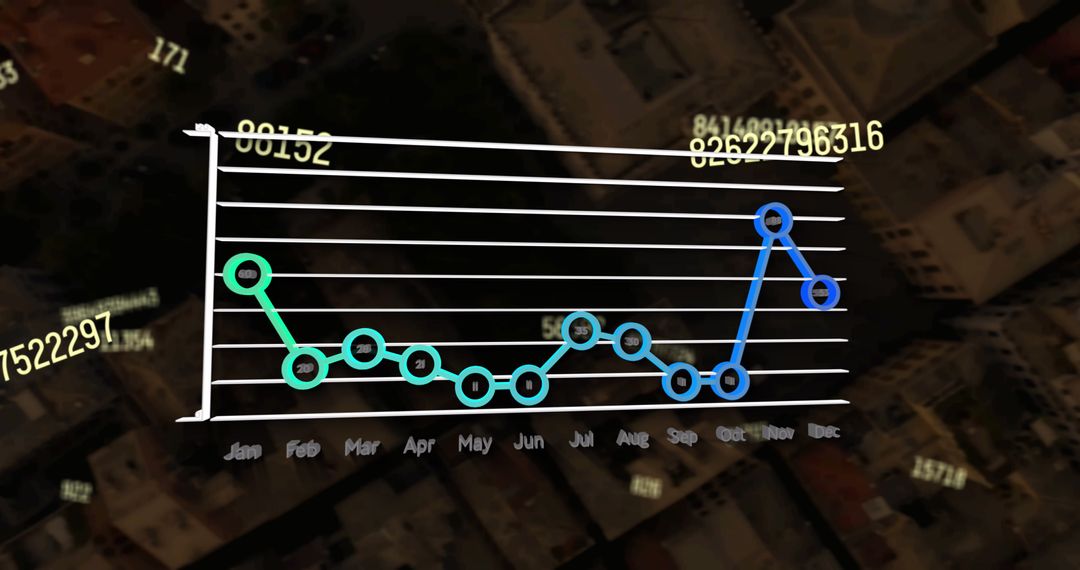
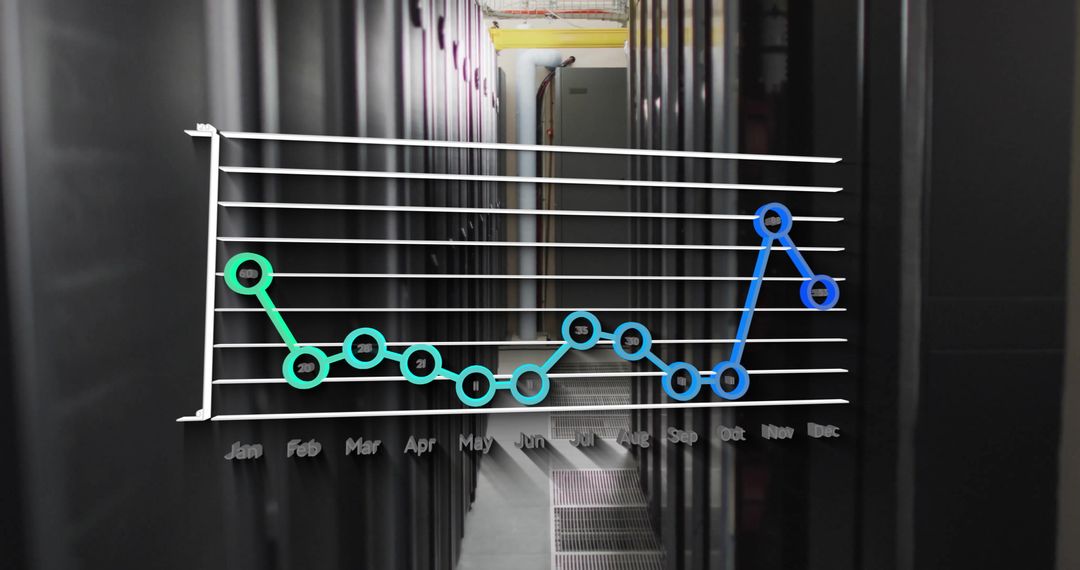
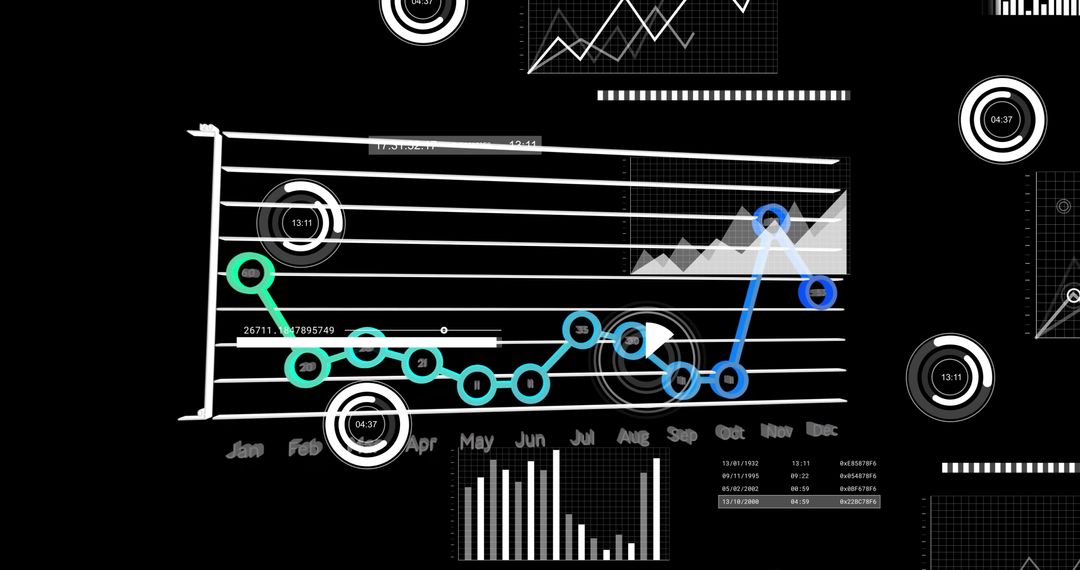
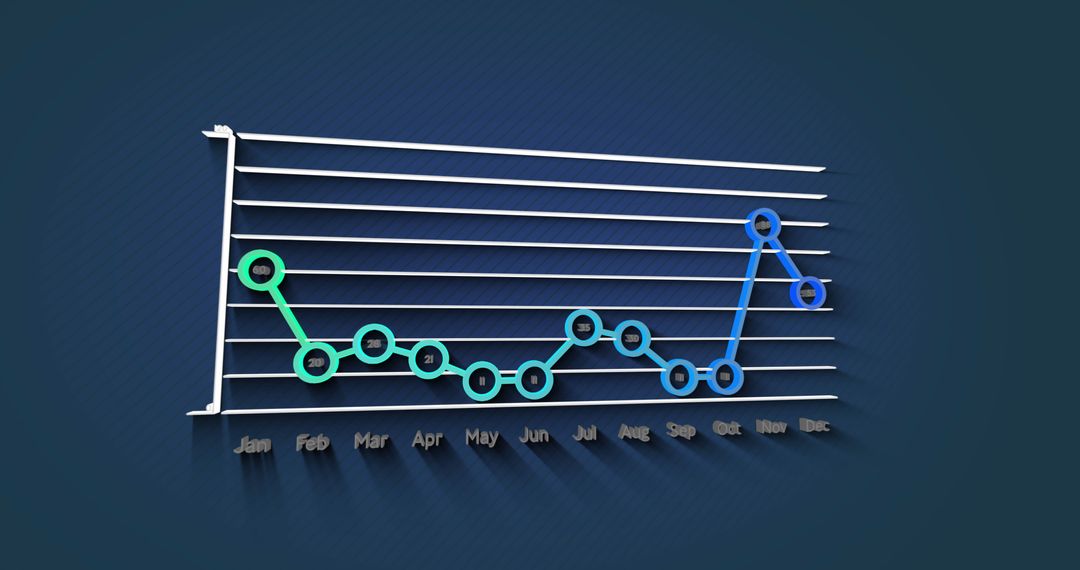
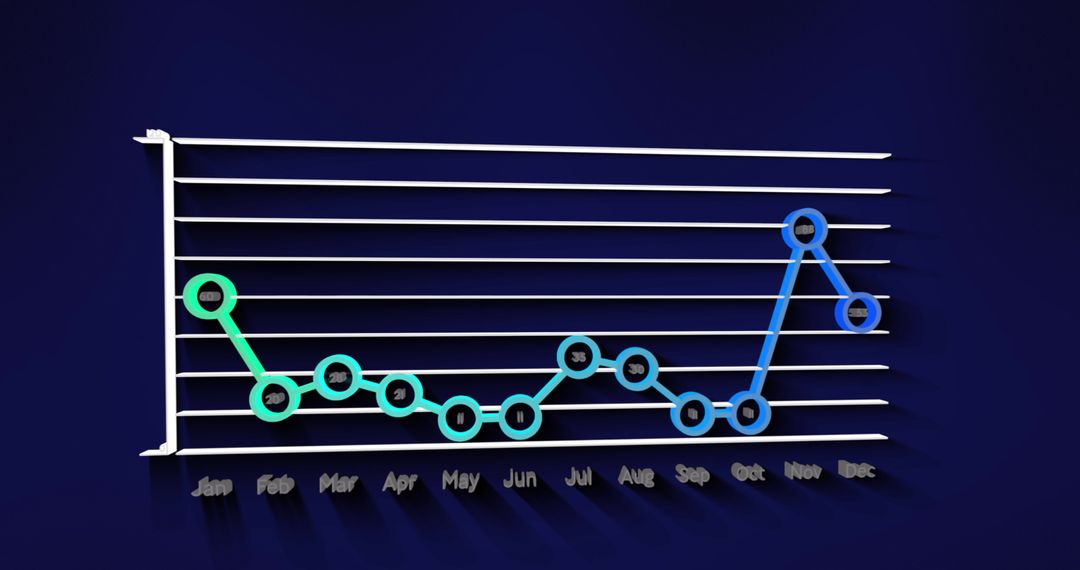
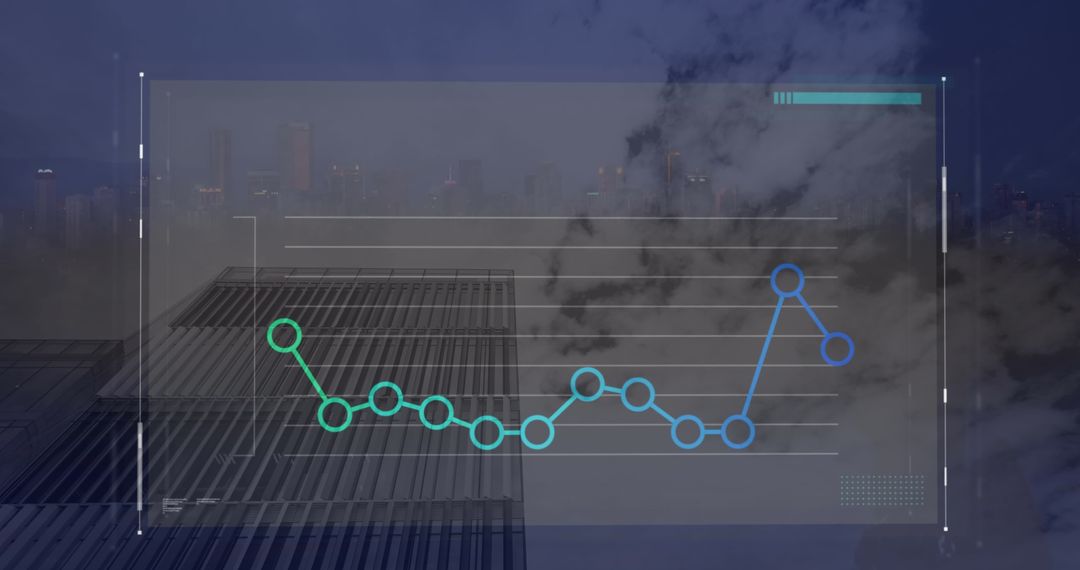
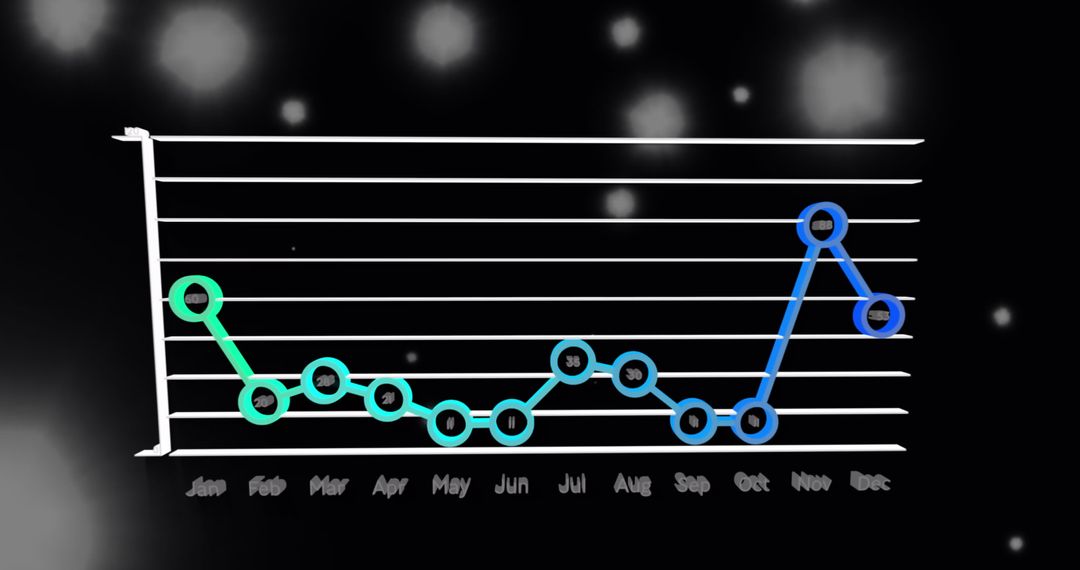
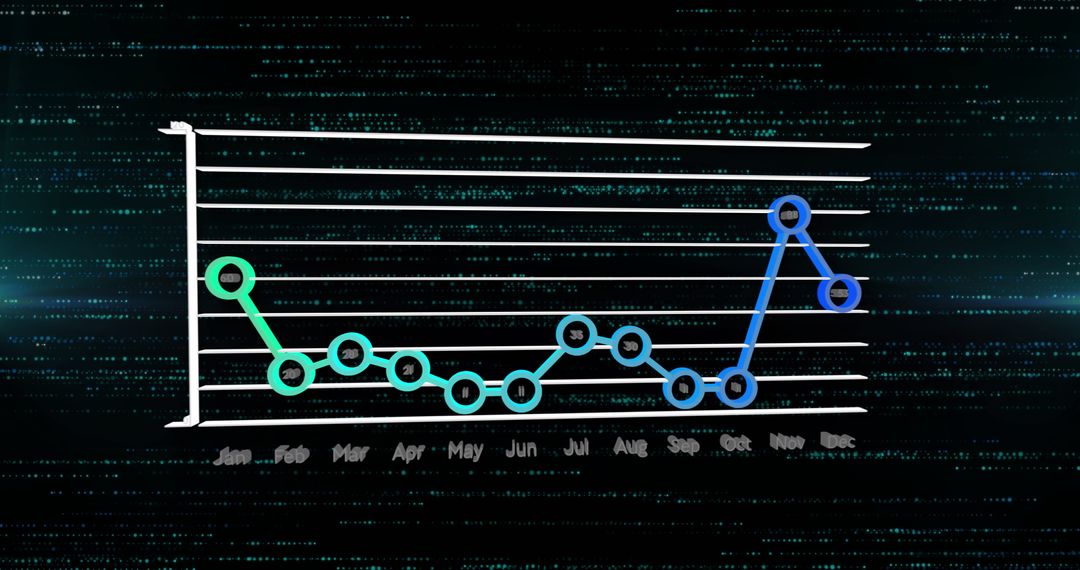
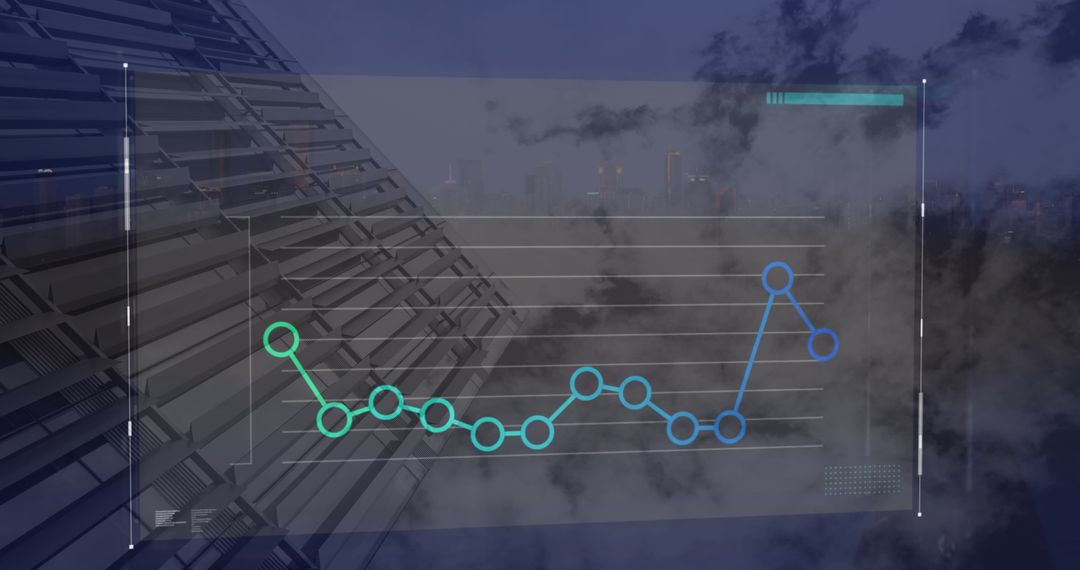
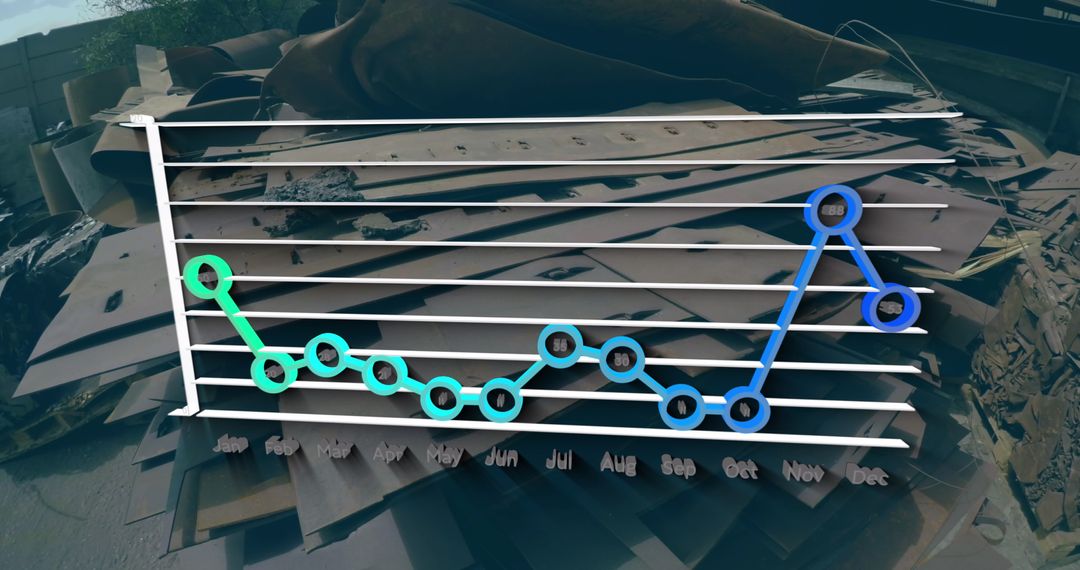
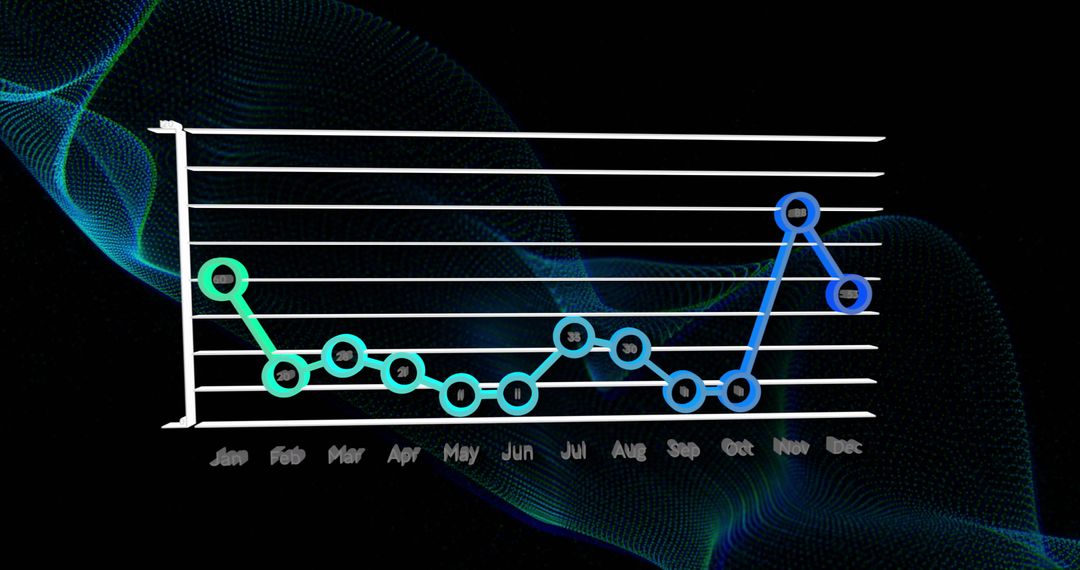
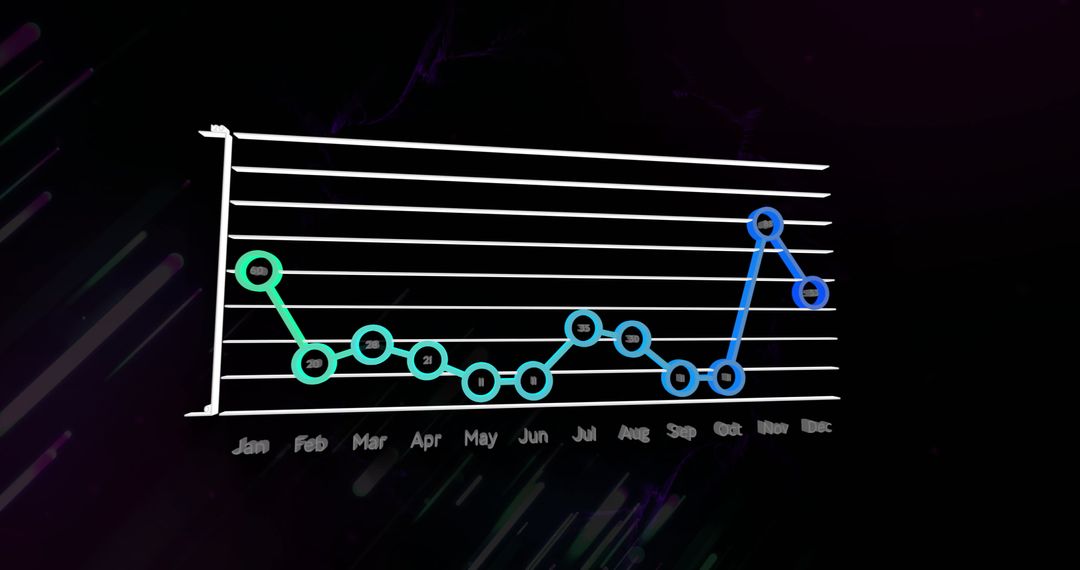
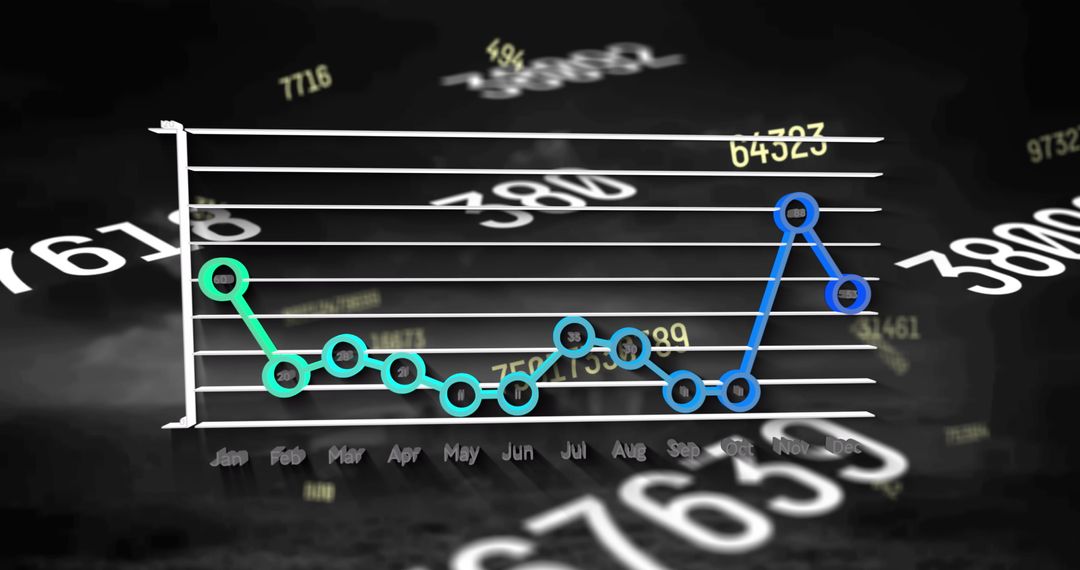
- 3D Line Chart on Dark Dashboard Displaying Monthly Data Trends
3D Line Chart on Dark Dashboard Displaying Monthly Data Trends Image

Visualizing data with 3D line chart over dark background highlights modern trends in business intelligence and technology. Ideal for use in presentations, reports, or dashboards.
Powered by 


0
downloads
downloads
Tags:
More
Credit Photo
If you would like to credit the Photo, here are some ways you can do so
Text Link
photo Link
<span class="text-link">
<span>
<a target="_blank" href=https://pikwizard.com/photo/3d-line-chart-on-dark-dashboard-displaying-monthly-data-trends/eaae6dc84056bbd1bb61889f3a9117e5/>PikWizard</a>
</span>
</span>
<span class="image-link">
<span
style="margin: 0 0 20px 0; display: inline-block; vertical-align: middle; width: 100%;"
>
<a
target="_blank"
href="https://pikwizard.com/photo/3d-line-chart-on-dark-dashboard-displaying-monthly-data-trends/eaae6dc84056bbd1bb61889f3a9117e5/"
style="text-decoration: none; font-size: 10px; margin: 0;"
>
<img src="https://pikwizard.com/pw/medium/eaae6dc84056bbd1bb61889f3a9117e5.jpg" style="margin: 0; width: 100%;" alt="" />
<p style="font-size: 12px; margin: 0;">PikWizard</p>
</a>
</span>
</span>
Free (free of charge)
Free for personal and commercial use.
Author: Awesome Content
Similar Free Stock Images