- Home >
- Stock Photos >
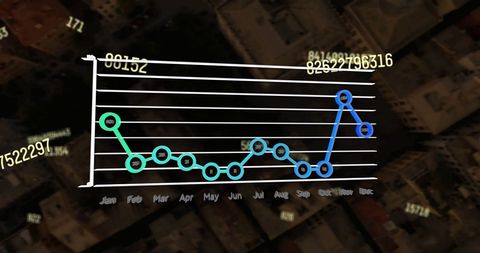
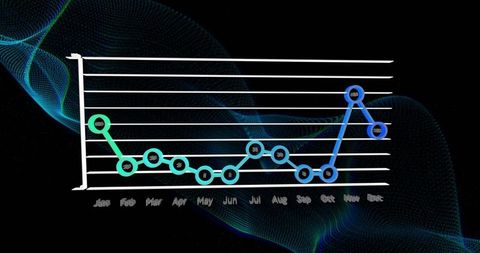
- 3D Line Graph Showcasing Monthly Data Trends
3D Line Graph Showcasing Monthly Data Trends Image

Colorful 3D line graph dynamically presenting monthly data trends. Useful for illustrating statistical data analysis, showcasing growth, and creating engaging infographics for business presentations. The visual appeal makes data interpretation more interactive and understandable.

downloads
Tags:
More
Credit Photo
If you would like to credit the Photo, here are some ways you can do so
Text Link
photo Link
<span class="text-link">
<span>
<a target="_blank" href=https://pikwizard.com/photo/3d-line-graph-showcasing-monthly-data-trends/15f25af282f39d5bdcdb9d9bd1e4df4a/>PikWizard</a>
</span>
</span>
<span class="image-link">
<span
style="margin: 0 0 20px 0; display: inline-block; vertical-align: middle; width: 100%;"
>
<a
target="_blank"
href="https://pikwizard.com/photo/3d-line-graph-showcasing-monthly-data-trends/15f25af282f39d5bdcdb9d9bd1e4df4a/"
style="text-decoration: none; font-size: 10px; margin: 0;"
>
<img src="https://pikwizard.com/pw/medium/15f25af282f39d5bdcdb9d9bd1e4df4a.jpg" style="margin: 0; width: 100%;" alt="" />
<p style="font-size: 12px; margin: 0;">PikWizard</p>
</a>
</span>
</span>
Free (free of charge)
Free for personal and commercial use.
Author: Creative Art