
- Home >
- Stock Photos >
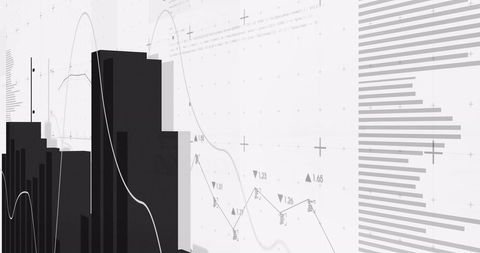
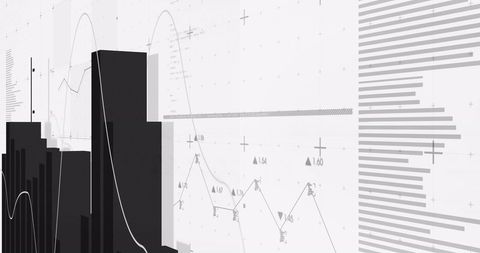
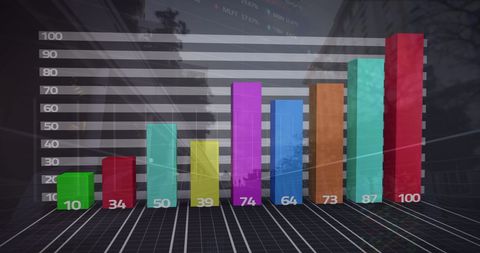
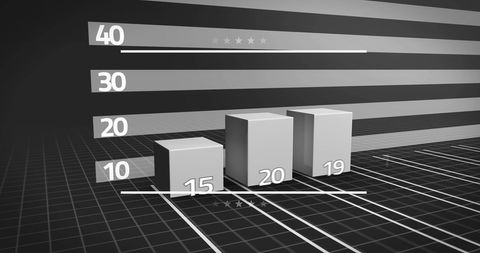
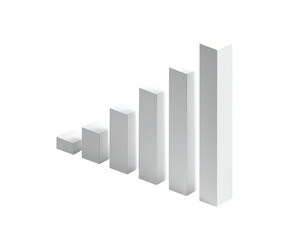
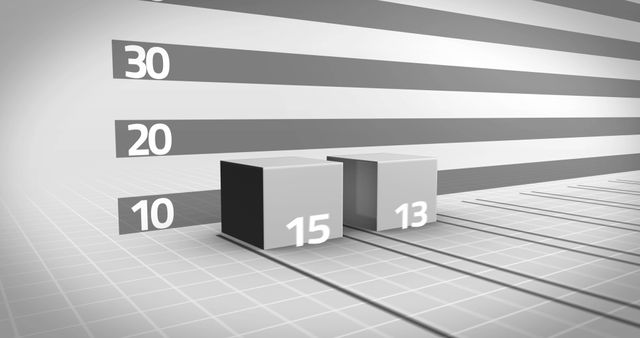
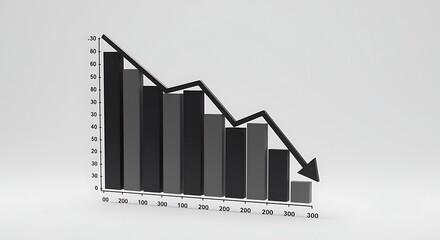
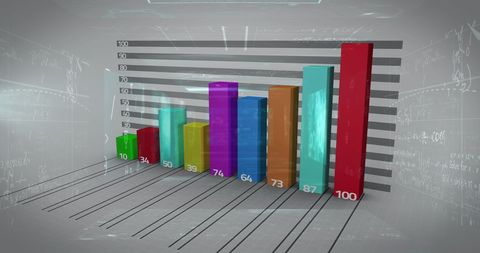
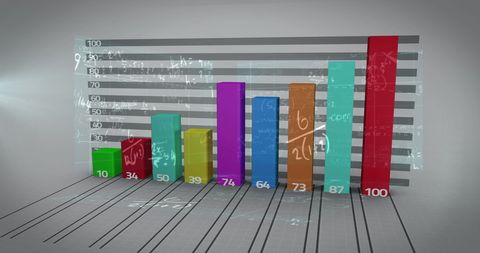
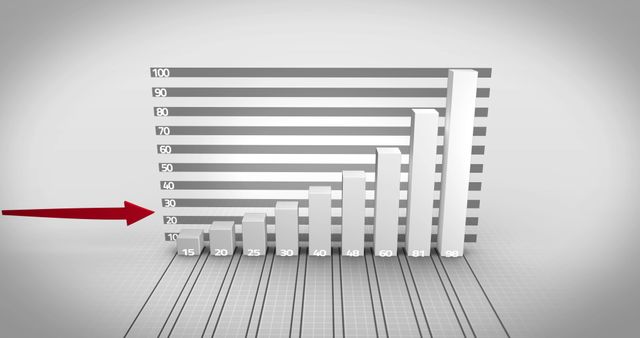
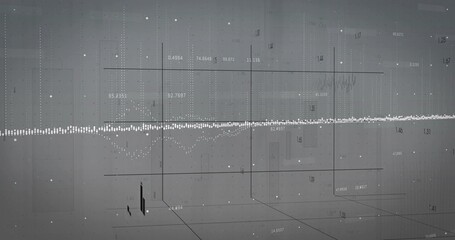
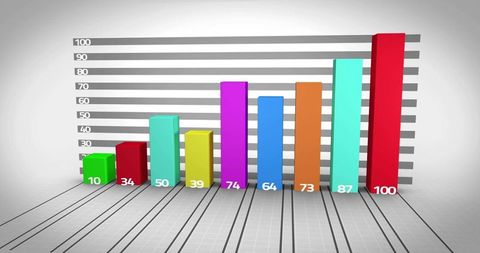
- 3D Monochrome Bar Graph Data Analysis Representation
3D Monochrome Bar Graph Data Analysis Representation Image
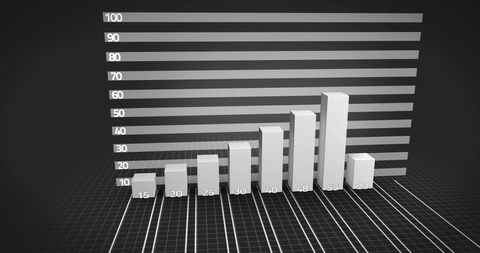
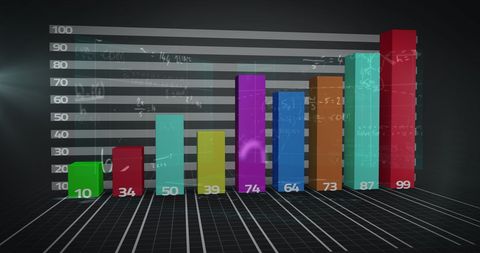
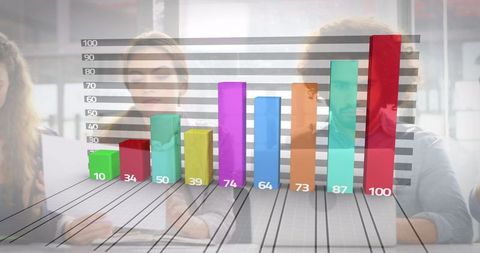
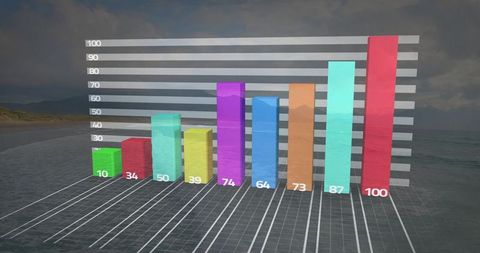
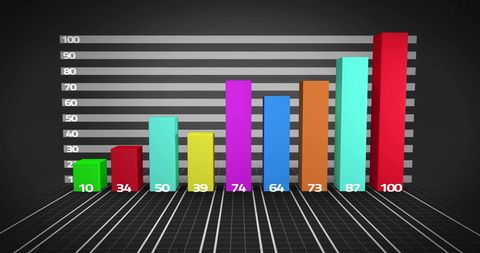
Digital rendering of a monochrome 3D bar graph displays various statistical data, highlighting trends and growth patterns. This illustration is ideal for use in financial presentations, business reports, market analysis slides, and educational materials focusing on data interpretation and visualization. Perfect for conveying clear statistical insights to stakeholders or teams.
Powered by 


downloads
Tags:
More
Credit Photo
If you would like to credit the Photo, here are some ways you can do so
Text Link
photo Link
<span class="text-link">
<span>
<a target="_blank" href=https://pikwizard.com/photo/3d-monochrome-bar-graph-data-analysis-representation/0064eeacbac3428d9e2e6ed70697f778/>PikWizard</a>
</span>
</span>
<span class="image-link">
<span
style="margin: 0 0 20px 0; display: inline-block; vertical-align: middle; width: 100%;"
>
<a
target="_blank"
href="https://pikwizard.com/photo/3d-monochrome-bar-graph-data-analysis-representation/0064eeacbac3428d9e2e6ed70697f778/"
style="text-decoration: none; font-size: 10px; margin: 0;"
>
<img src="https://pikwizard.com/pw/medium/0064eeacbac3428d9e2e6ed70697f778.jpg" style="margin: 0; width: 100%;" alt="" />
<p style="font-size: 12px; margin: 0;">PikWizard</p>
</a>
</span>
</span>
Free (free of charge)
Free for personal and commercial use.
Author: Authentic Images
Similar Free Stock Images

Premium

Premium


AI

Premium


Premium


Premium


Premium


Premium


Premium

Premium


Premium


Premium


Premium


Premium


Premium

Premium


Premium


Premium


Premium


Premium

Premium

Premium


Premium


Premium


Premium


Premium


Explore More Free Stock Images