- Home >
- Stock Photos >
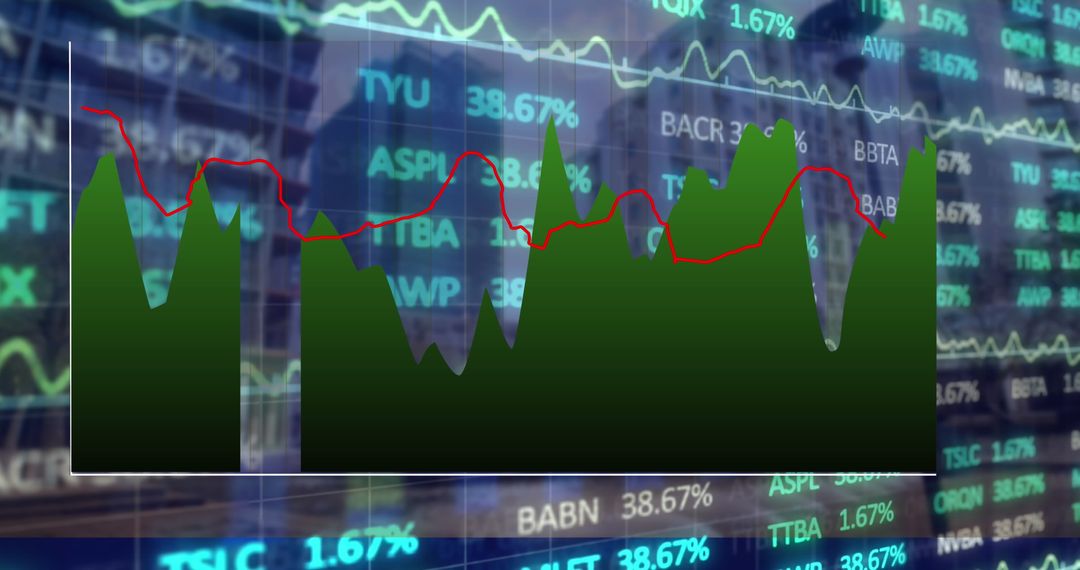
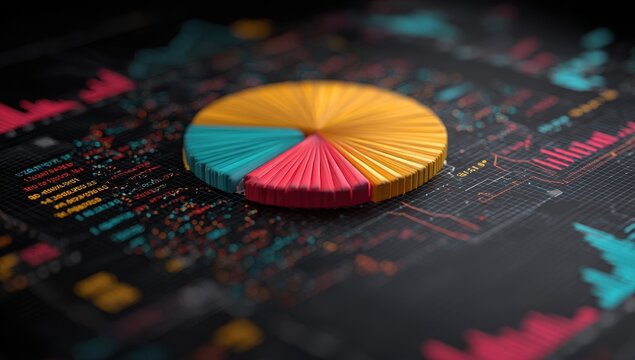
- 3D Pie Chart Over Financial Dashboard with Scrolling Tickers
3D Pie Chart Over Financial Dashboard with Scrolling Tickers Image

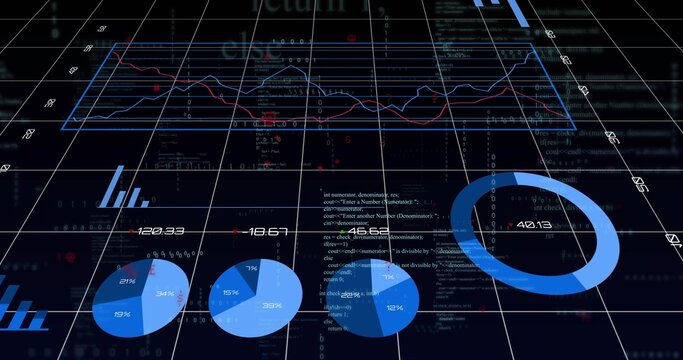
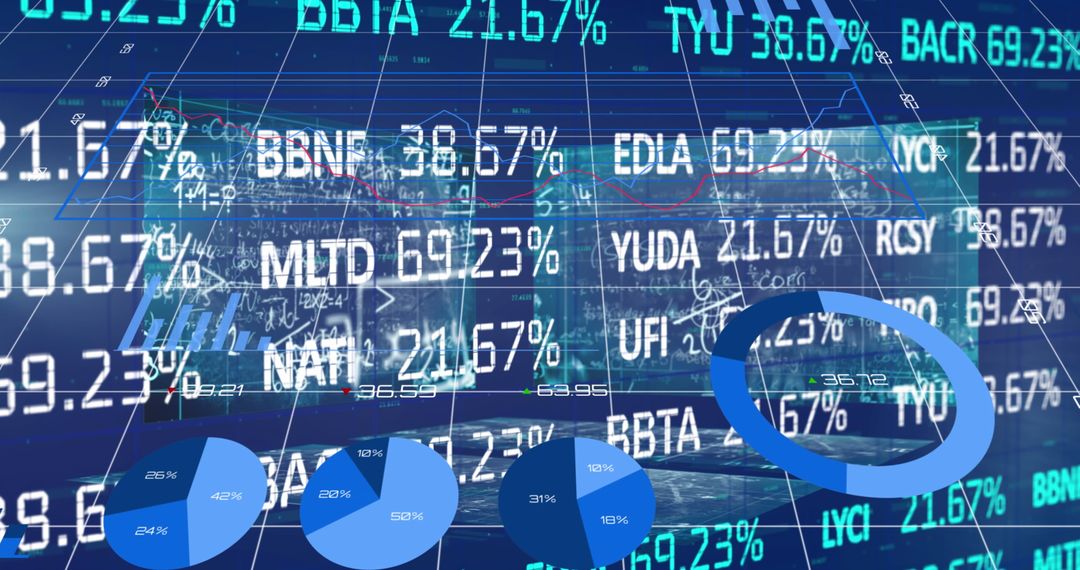
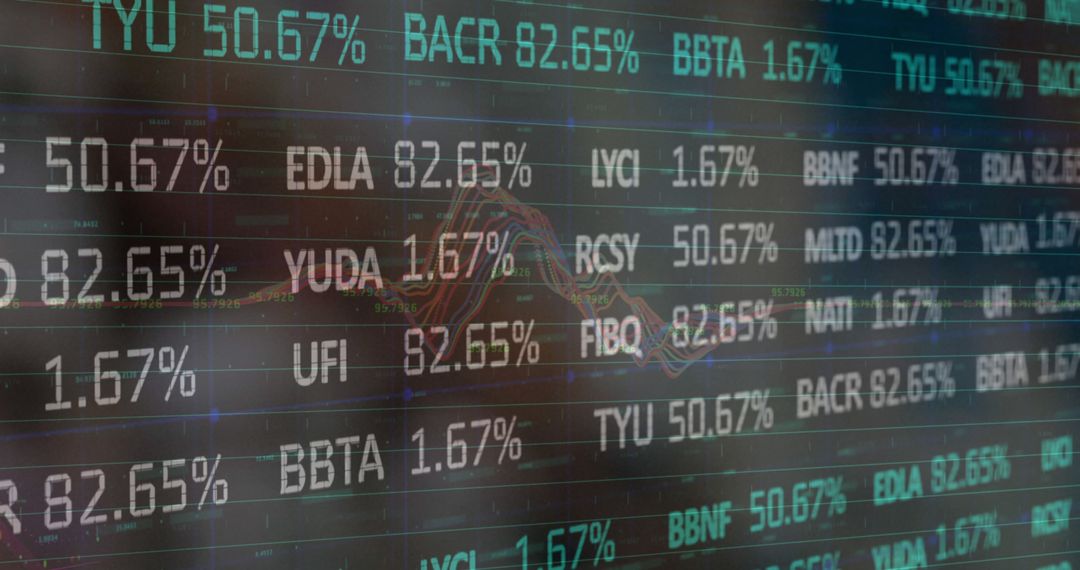
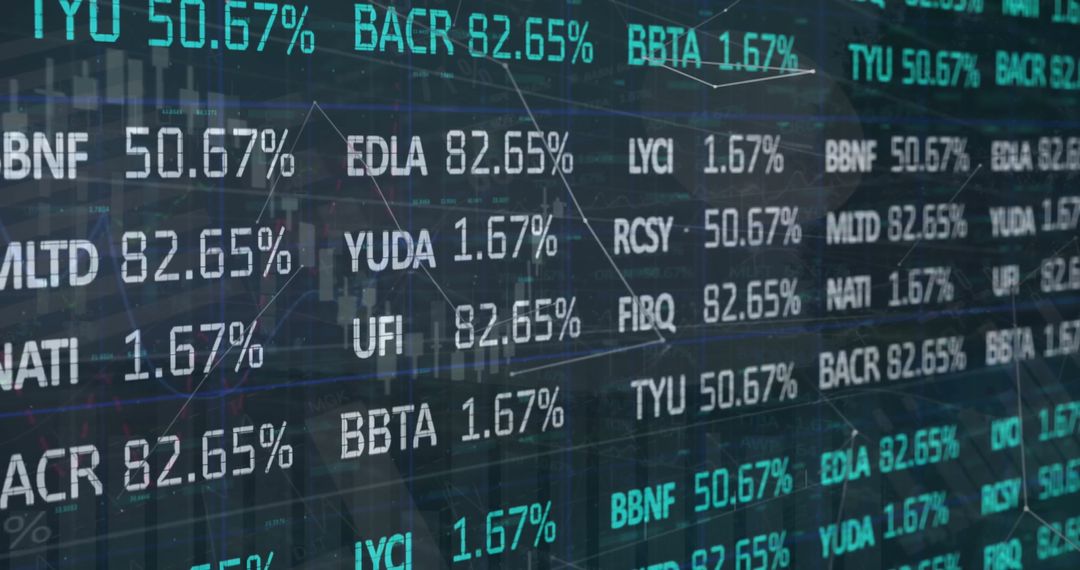
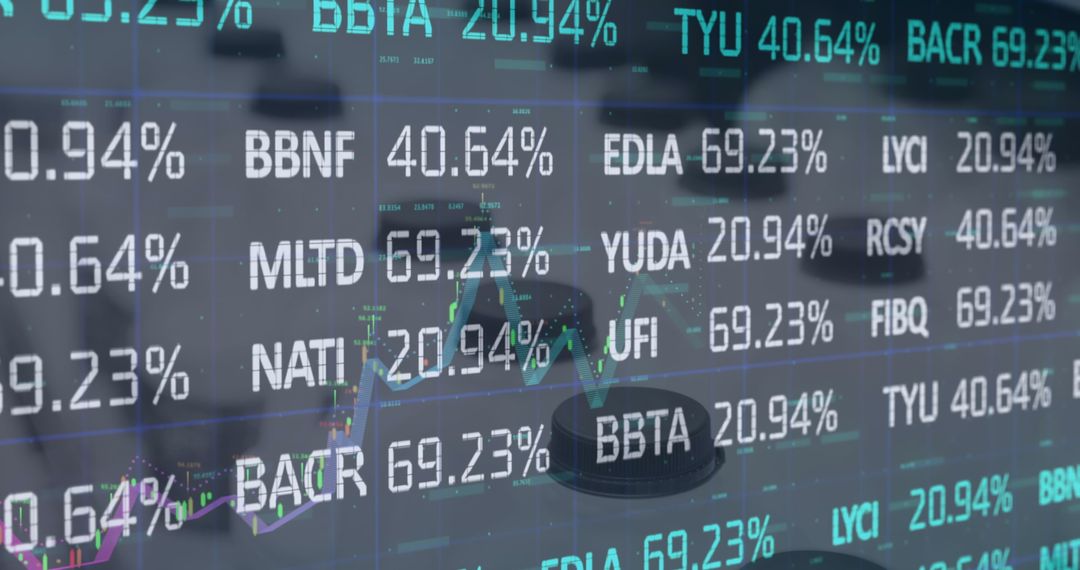
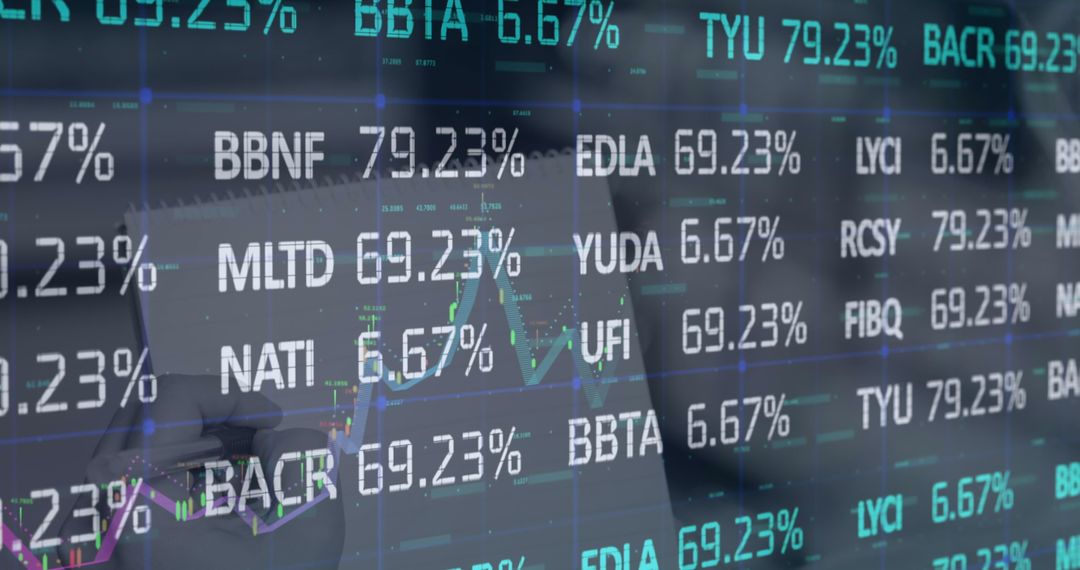
The image showcases a translucent 3D pie chart floating above a financial dashboard interface, with scrolling tickers indicating market data. This represent advanced analytics in finance, emphasizing technology-driven solutions. Ideal for illustrating topics in economics, investment trends, data visualization in finance, and digital transformation in commerce. Suitable for banking, financial institution presentations, corporate training materials, or technology showcases.
Powered by 


2
downloads
downloads
Tags:
More
Credit Photo
If you would like to credit the Photo, here are some ways you can do so
Text Link
photo Link
<span class="text-link">
<span>
<a target="_blank" href=https://pikwizard.com/photo/3d-pie-chart-over-financial-dashboard-with-scrolling-tickers/4c243a82aa27cb96780dc58104904511/>PikWizard</a>
</span>
</span>
<span class="image-link">
<span
style="margin: 0 0 20px 0; display: inline-block; vertical-align: middle; width: 100%;"
>
<a
target="_blank"
href="https://pikwizard.com/photo/3d-pie-chart-over-financial-dashboard-with-scrolling-tickers/4c243a82aa27cb96780dc58104904511/"
style="text-decoration: none; font-size: 10px; margin: 0;"
>
<img src="https://pikwizard.com/pw/medium/4c243a82aa27cb96780dc58104904511.jpg" style="margin: 0; width: 100%;" alt="" />
<p style="font-size: 12px; margin: 0;">PikWizard</p>
</a>
</span>
</span>
Free (free of charge)
Free for personal and commercial use.
Author: Authentic Images
Similar Free Stock Images

Premium


Premium


Premium


Premium


Premium


Premium


Premium


Premium


Premium


Premium


Premium


Premium


Premium


Premium


Premium


Premium


Premium


Premium


Premium


Premium


Premium


Premium


Premium


Premium