- Home >
- Stock Photos >
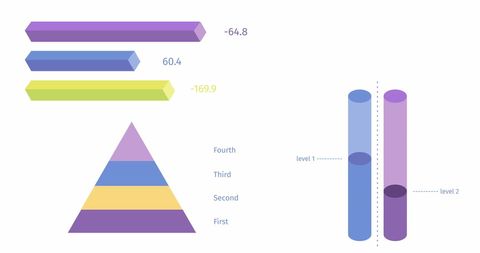
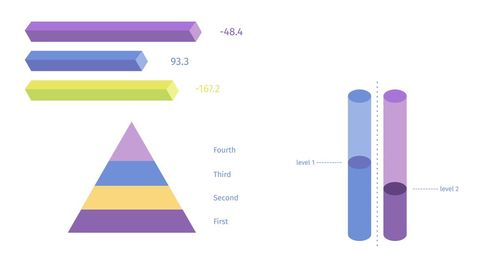
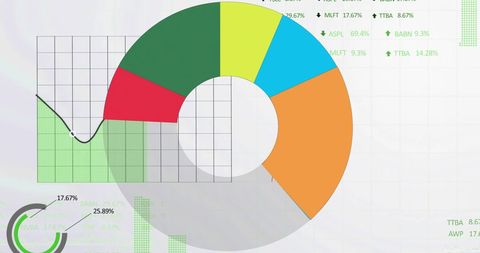
- 3D Pie Chart with Various Graphs on White Background
3D Pie Chart with Various Graphs on White Background Image

3D pie chart in focus with diverse graphs and charts symbolizing financial data processing and statistical analysis. Use for business presentations, economic reports, data relationship illustrations, or educational materials focused on analytical concepts.

downloads
Tags:
More
Credit Photo
If you would like to credit the Photo, here are some ways you can do so
Text Link
photo Link
<span class="text-link">
<span>
<a target="_blank" href=https://pikwizard.com/photo/3d-pie-chart-with-various-graphs-on-white-background/83ba4bc6613c547de57d5cdca1ee0ea6/>PikWizard</a>
</span>
</span>
<span class="image-link">
<span
style="margin: 0 0 20px 0; display: inline-block; vertical-align: middle; width: 100%;"
>
<a
target="_blank"
href="https://pikwizard.com/photo/3d-pie-chart-with-various-graphs-on-white-background/83ba4bc6613c547de57d5cdca1ee0ea6/"
style="text-decoration: none; font-size: 10px; margin: 0;"
>
<img src="https://pikwizard.com/pw/medium/83ba4bc6613c547de57d5cdca1ee0ea6.jpg" style="margin: 0; width: 100%;" alt="" />
<p style="font-size: 12px; margin: 0;">PikWizard</p>
</a>
</span>
</span>
Free (free of charge)
Free for personal and commercial use.
Author: Awesome Content