- Home >
- Stock Photos >
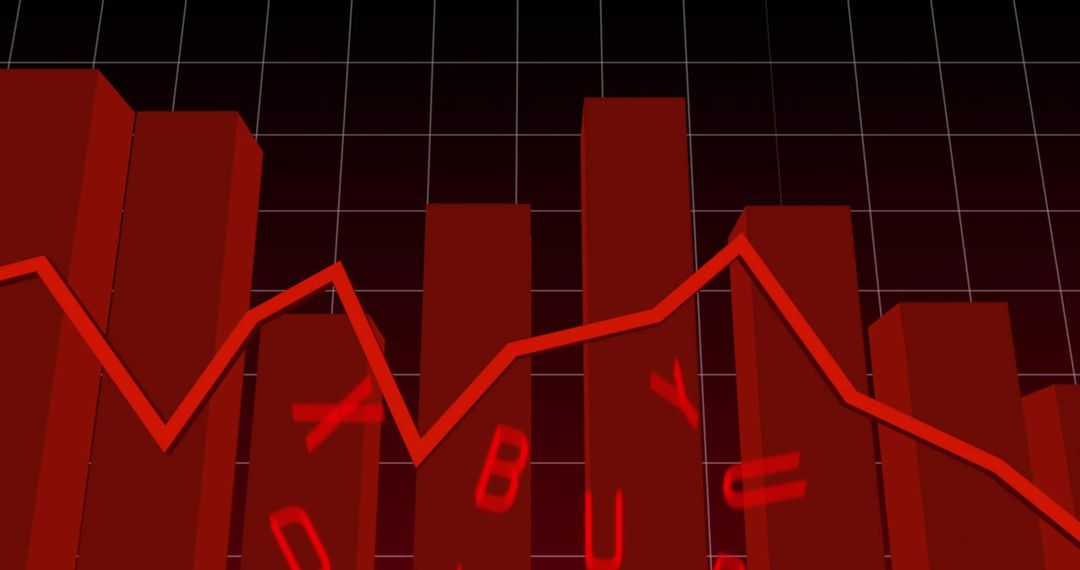
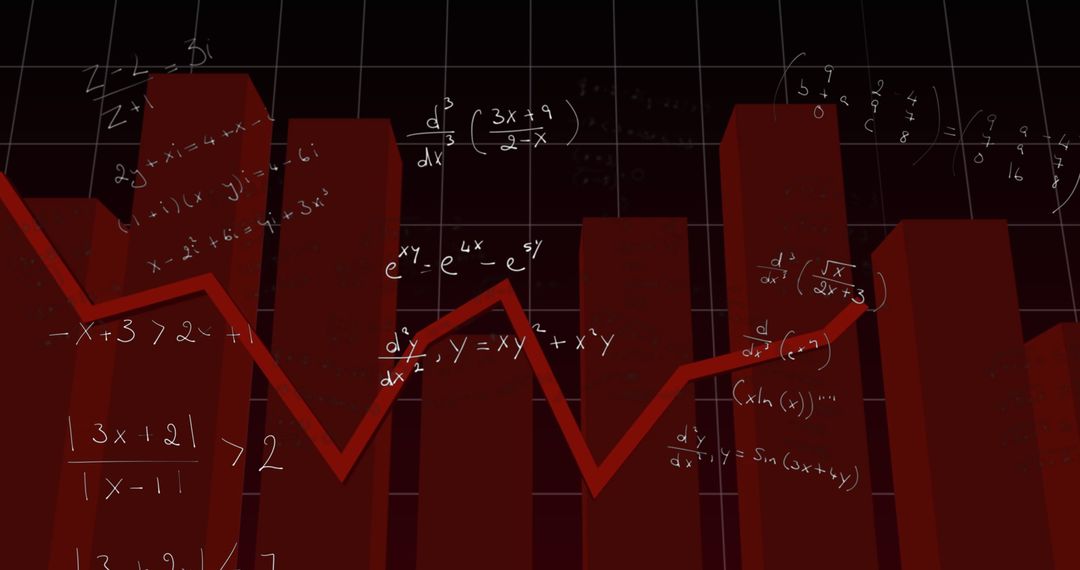
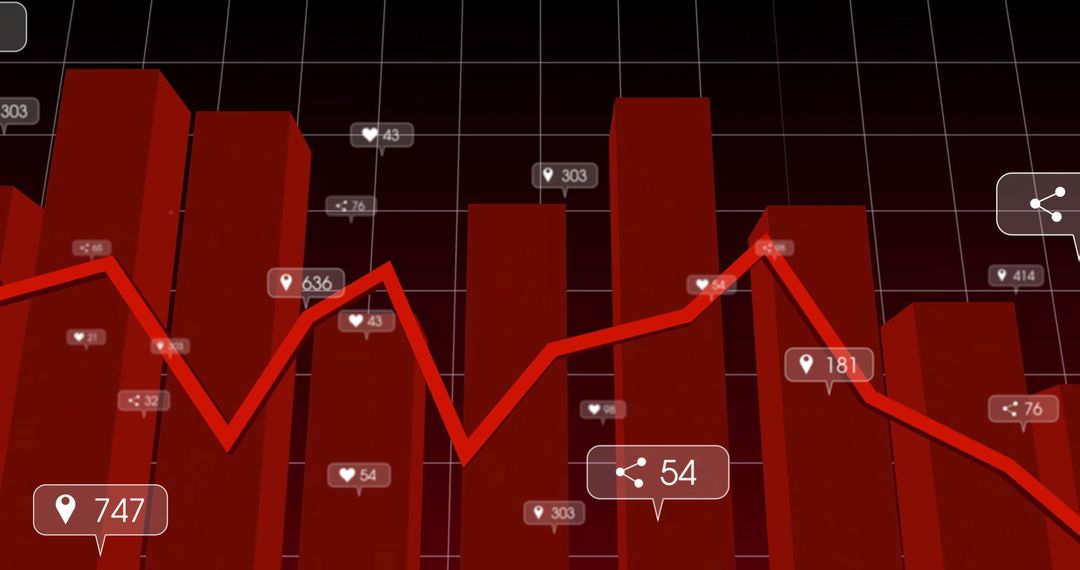
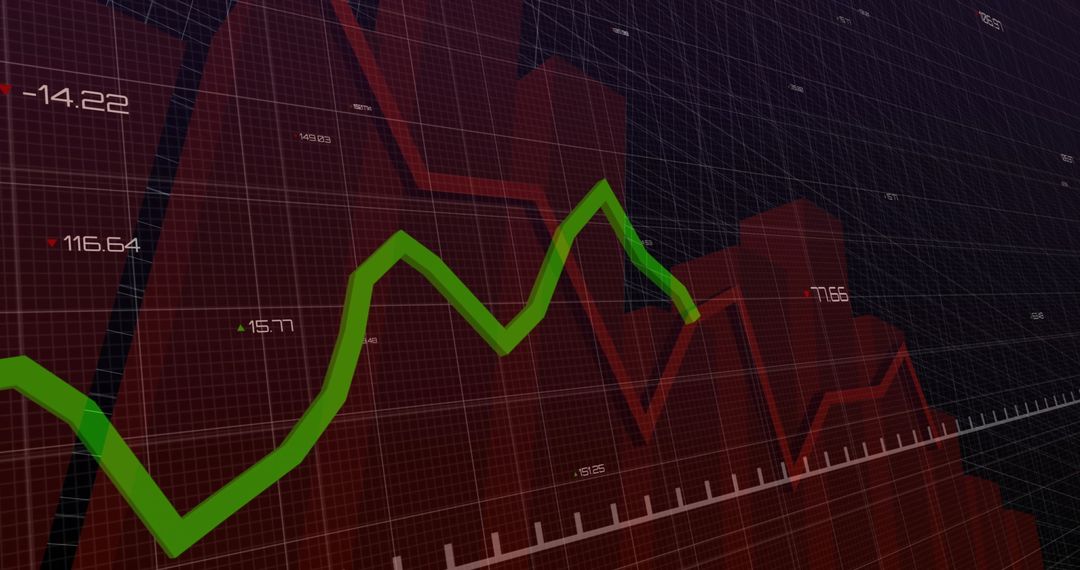
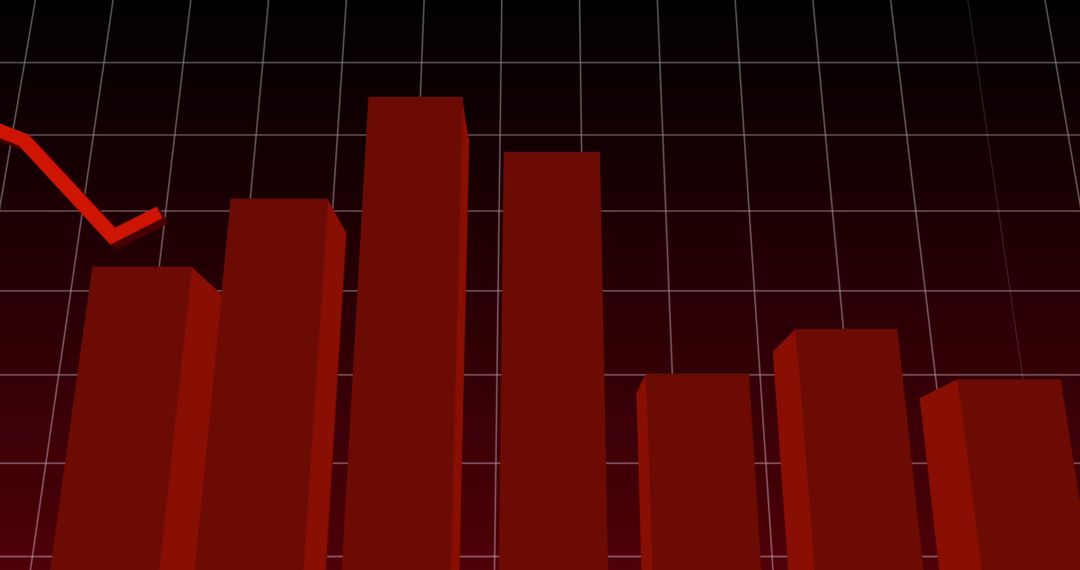
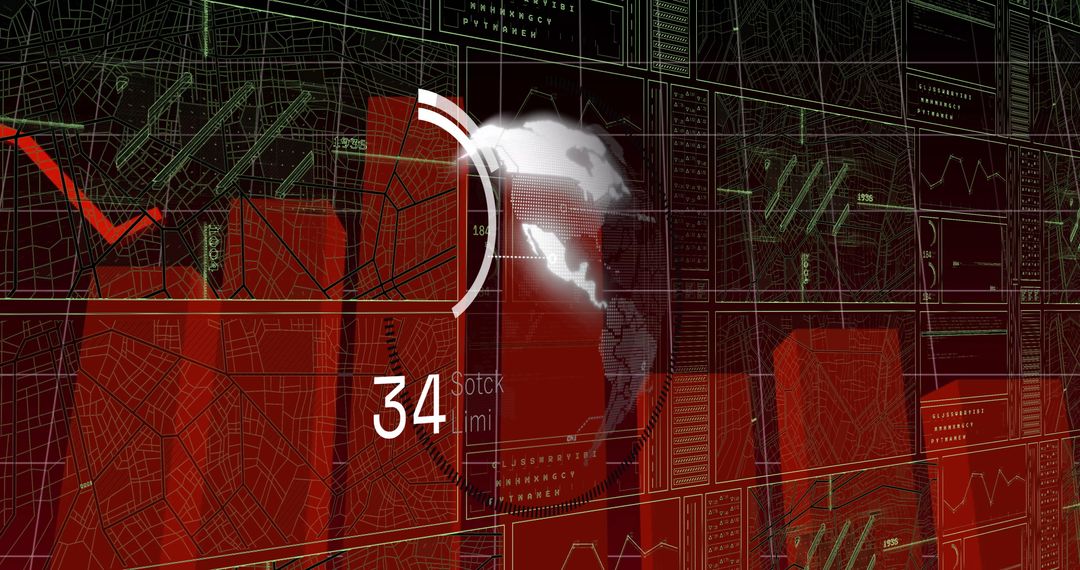
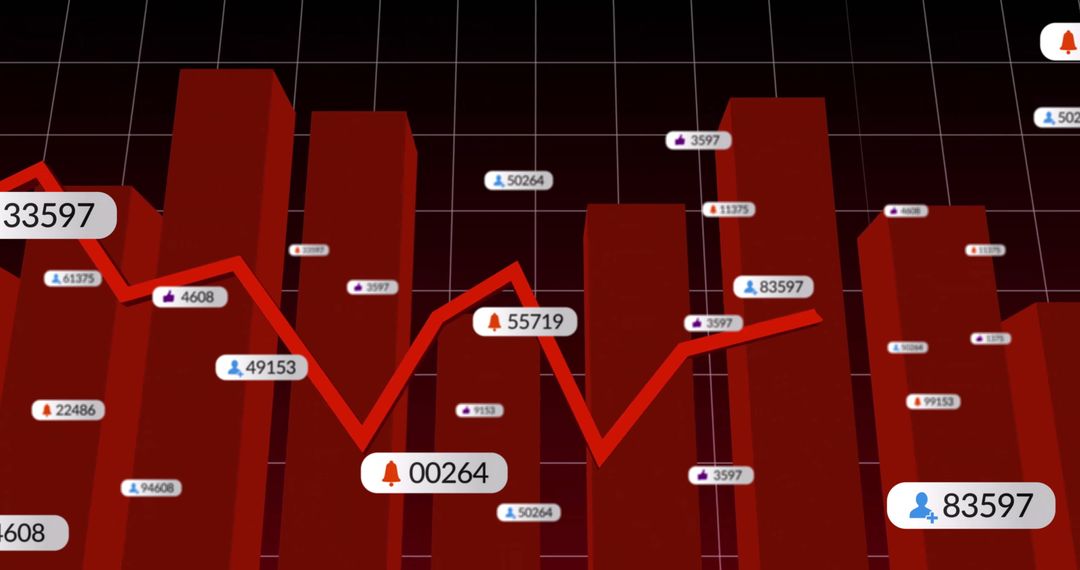
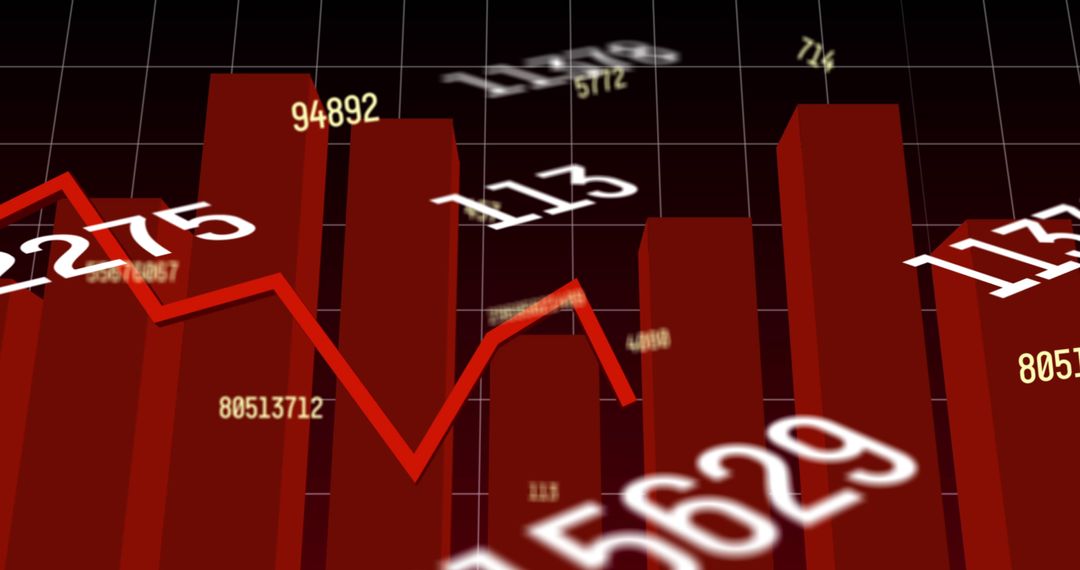
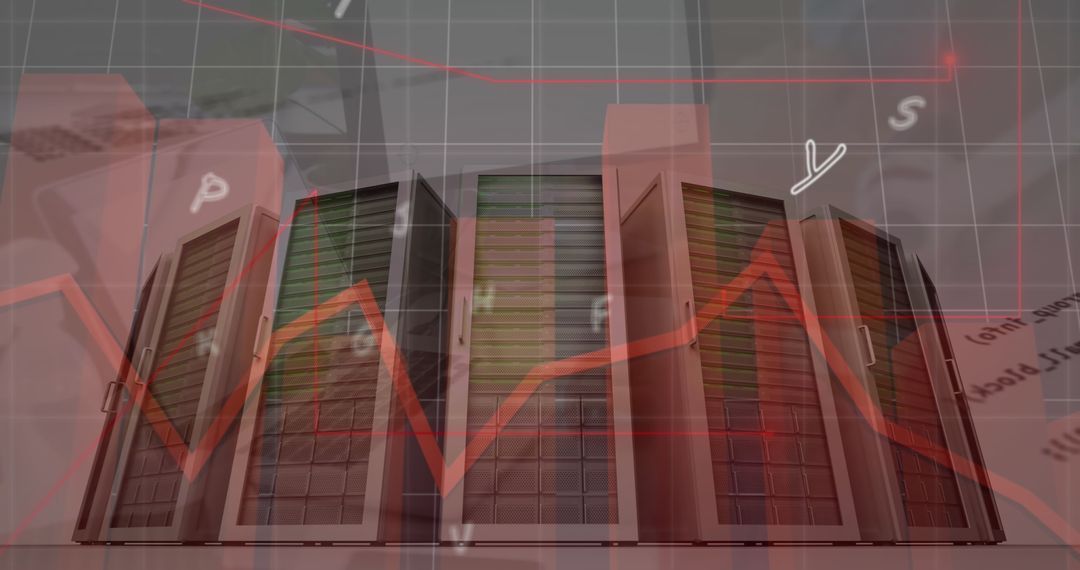
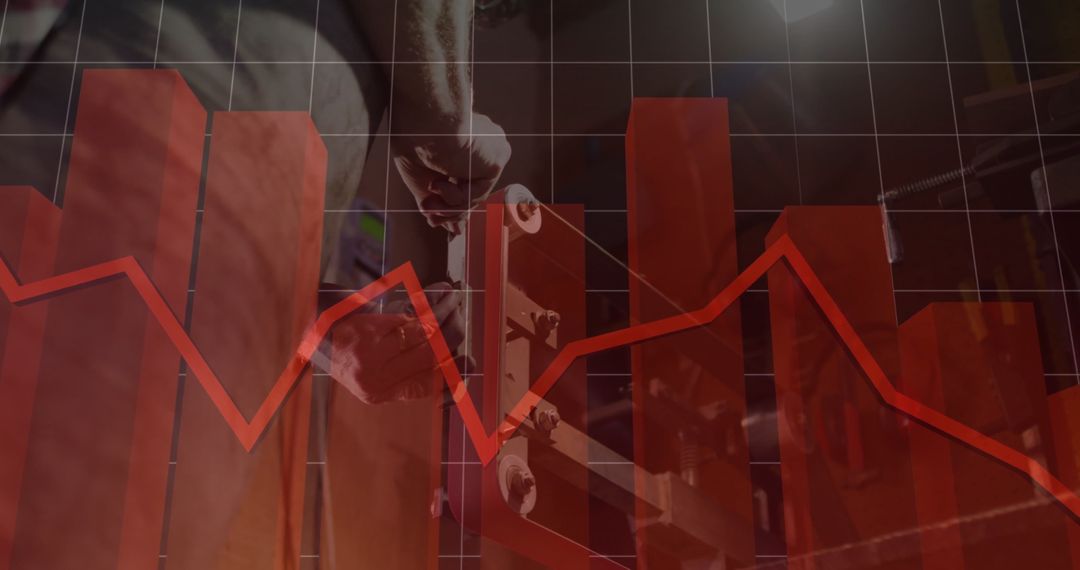
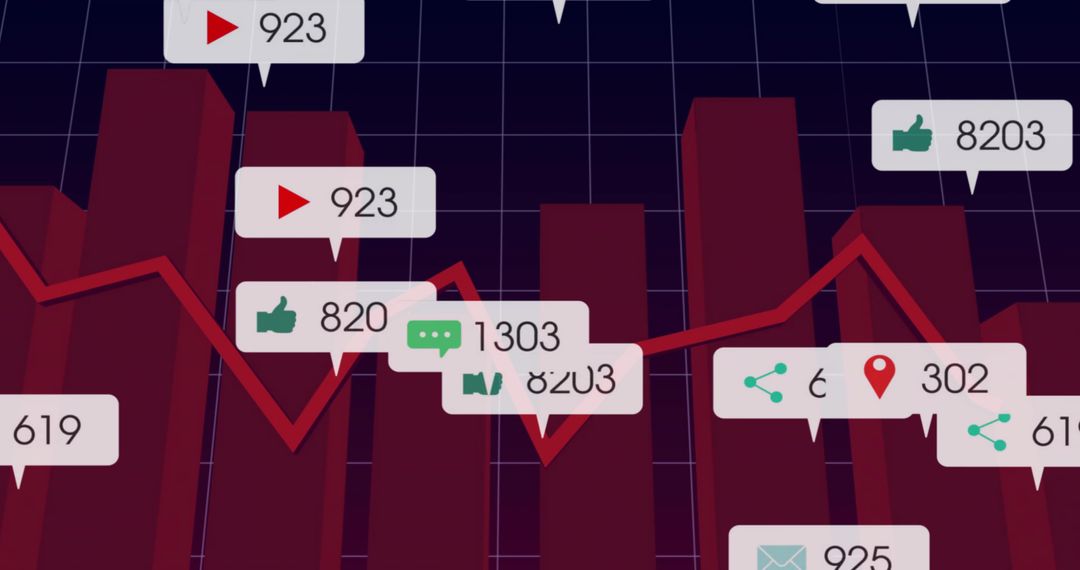
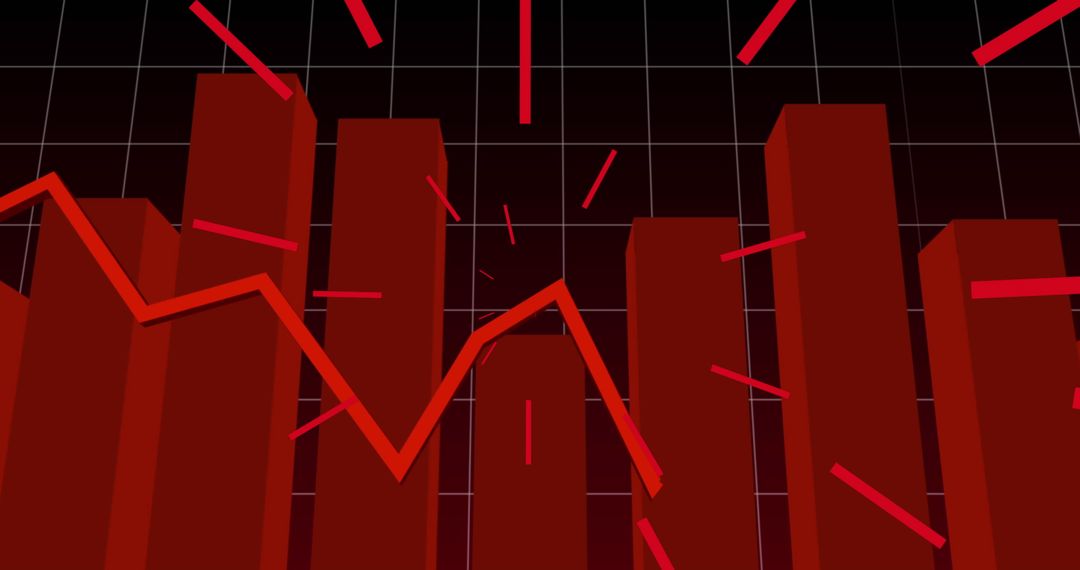
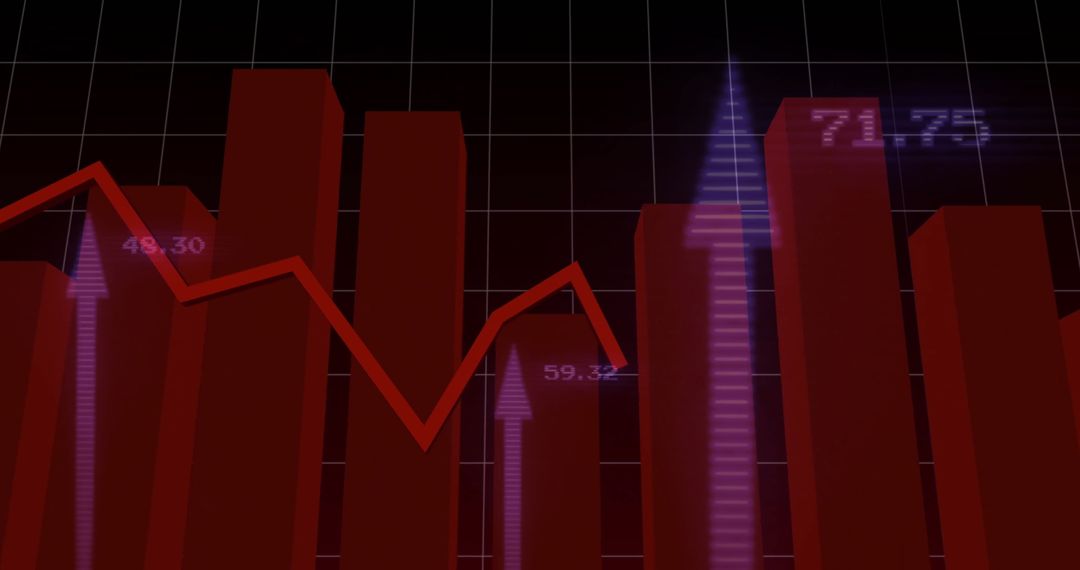
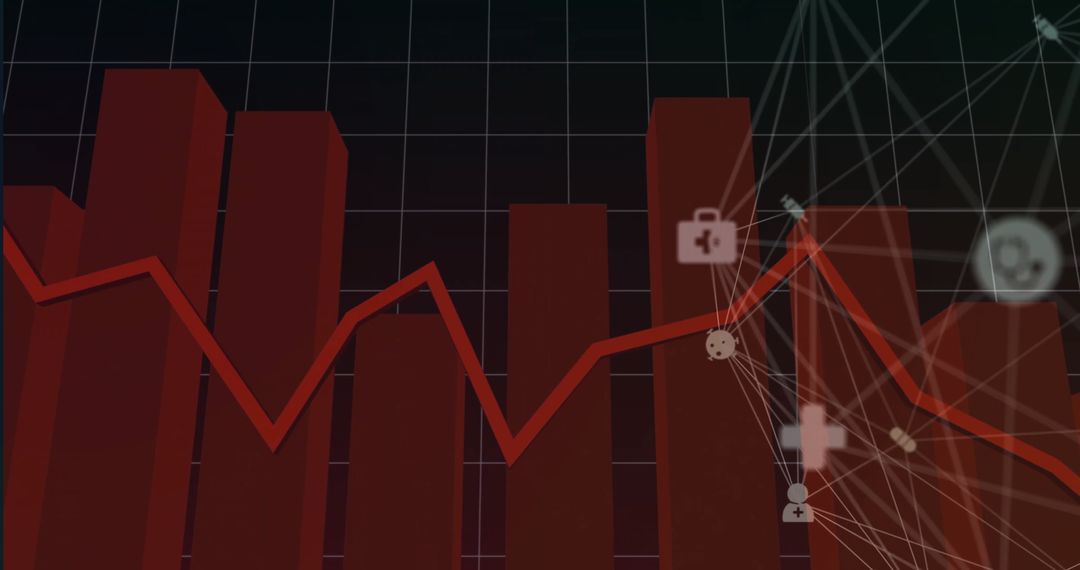
- 3D Red Bar Chart with Sustainability Icons in Digital Dashboard
3D Red Bar Chart with Sustainability Icons in Digital Dashboard Image
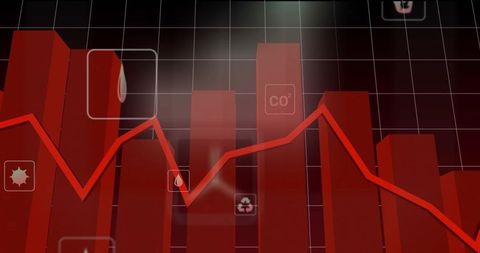
Red 3D bar chart shows fluctuations with overlay icons like droplets, CO2, and recycling, signifying environmental data tracking. Suitable for illustrating analytics, sustainable energy monitoring, technology insights, eco-friendly data management, or data-driven decision tools. Useful for presentations, reports, and educational material on data visualization and environmental sustainability.
Powered by 


0
downloads
downloads
Tags:
More
Credit Photo
If you would like to credit the Photo, here are some ways you can do so
Text Link
photo Link
<span class="text-link">
<span>
<a target="_blank" href=https://pikwizard.com/photo/3d-red-bar-chart-with-sustainability-icons-in-digital-dashboard/298307fcf6a7d1a4aa47a7a1a4040a59/>PikWizard</a>
</span>
</span>
<span class="image-link">
<span
style="margin: 0 0 20px 0; display: inline-block; vertical-align: middle; width: 100%;"
>
<a
target="_blank"
href="https://pikwizard.com/photo/3d-red-bar-chart-with-sustainability-icons-in-digital-dashboard/298307fcf6a7d1a4aa47a7a1a4040a59/"
style="text-decoration: none; font-size: 10px; margin: 0;"
>
<img src="https://pikwizard.com/pw/medium/298307fcf6a7d1a4aa47a7a1a4040a59.jpg" style="margin: 0; width: 100%;" alt="" />
<p style="font-size: 12px; margin: 0;">PikWizard</p>
</a>
</span>
</span>
Free (free of charge)
Free for personal and commercial use.
Author: People Creations
Similar Free Stock Images

Premium


Premium


Premium


Premium


Premium


Premium

Premium


Premium


Premium


Premium


Premium


Premium


Premium


Premium


Premium


Premium


Premium


Premium


Premium


Premium


Premium


Premium


Premium

Premium