- Home >
- Stock Photos >
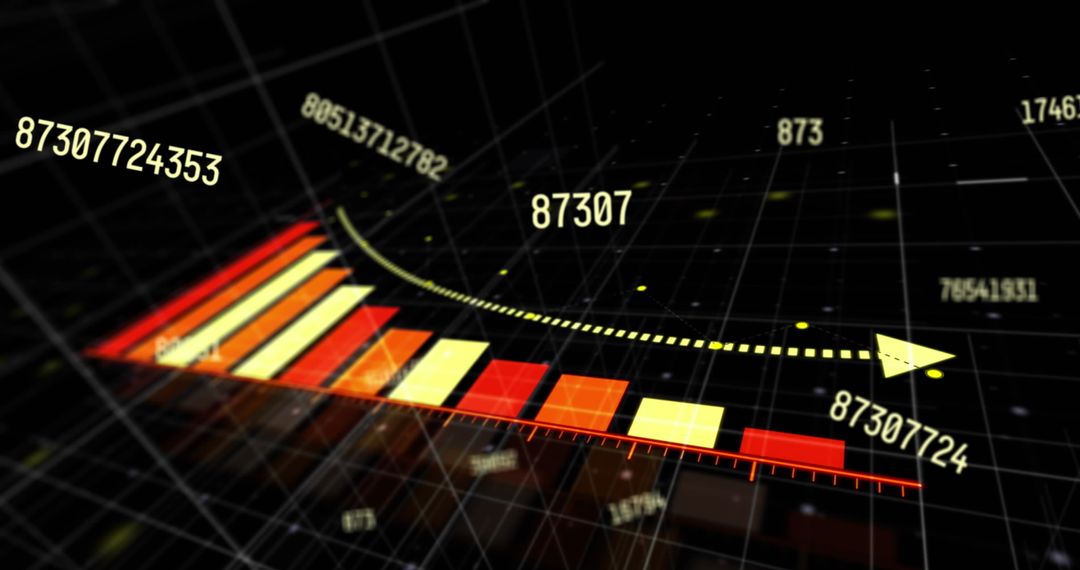
- 3D Red Bar Chart with Viral Icons on Digital Dashboard
3D Red Bar Chart with Viral Icons on Digital Dashboard Image

The scene shows a downward red bar chart with virus symbols and a dotted trend arrow extending over a digital grid interface. Dark blue background with numerical data and graphical elements emphasizes analysis and financial growth themes. Useful for illustrating showpieces on critical data evaluation, crises, business analyses, pandemic impacts, and finance tracking as it sheds light highlighting digital transformation in assessing evolving business challenges.
Powered by  - Get 15% off with code: PIKWIZARD15


2
downloads
downloads
Tags:
More
Credit Photo
If you would like to credit the Photo, here are some ways you can do so
Text Link
photo Link
<span class="text-link">
<span>
<a target="_blank" href=https://pikwizard.com/photo/3d-red-bar-chart-with-viral-icons-on-digital-dashboard/3df8a01c24d995692a65b6e8bb9e9d6f/>PikWizard</a>
</span>
</span>
<span class="image-link">
<span
style="margin: 0 0 20px 0; display: inline-block; vertical-align: middle; width: 100%;"
>
<a
target="_blank"
href="https://pikwizard.com/photo/3d-red-bar-chart-with-viral-icons-on-digital-dashboard/3df8a01c24d995692a65b6e8bb9e9d6f/"
style="text-decoration: none; font-size: 10px; margin: 0;"
>
<img src="https://pikwizard.com/pw/medium/3df8a01c24d995692a65b6e8bb9e9d6f.jpg" style="margin: 0; width: 100%;" alt="" />
<p style="font-size: 12px; margin: 0;">PikWizard</p>
</a>
</span>
</span>
Free (free of charge)
Free for personal and commercial use.
Author: Authentic Images
Similar Free Stock Images