- Home >
- Stock Photos >
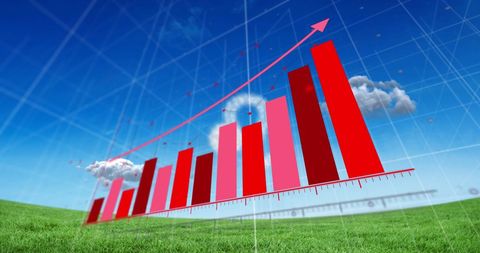
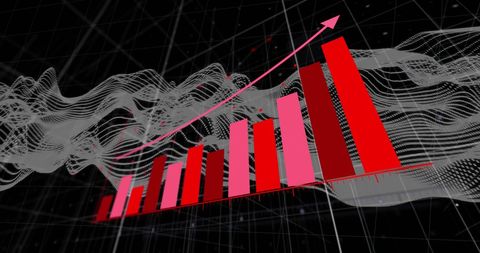
- 3D Rendered Red Bar Graph with Data Visual Elements
3D Rendered Red Bar Graph with Data Visual Elements Image

A red 3D bar graph represents business growth and data analysis over a digital framework backdrop, showcasing high-tech interface elements. Ideal for illustrating concepts of technological progress, global business analytics, or electronic data trends in business presentations, marketing content, or educational materials focused on digital advancements.

downloads
Tags:
More
Credit Photo
If you would like to credit the Photo, here are some ways you can do so
Text Link
photo Link
<span class="text-link">
<span>
<a target="_blank" href=https://pikwizard.com/photo/3d-rendered-red-bar-graph-with-data-visual-elements/5ebcc733249ae15090e53b8f05a7f78f/>PikWizard</a>
</span>
</span>
<span class="image-link">
<span
style="margin: 0 0 20px 0; display: inline-block; vertical-align: middle; width: 100%;"
>
<a
target="_blank"
href="https://pikwizard.com/photo/3d-rendered-red-bar-graph-with-data-visual-elements/5ebcc733249ae15090e53b8f05a7f78f/"
style="text-decoration: none; font-size: 10px; margin: 0;"
>
<img src="https://pikwizard.com/pw/medium/5ebcc733249ae15090e53b8f05a7f78f.jpg" style="margin: 0; width: 100%;" alt="" />
<p style="font-size: 12px; margin: 0;">PikWizard</p>
</a>
</span>
</span>
Free (free of charge)
Free for personal and commercial use.
Author: Creative Art