- Home >
- Stock Photos >
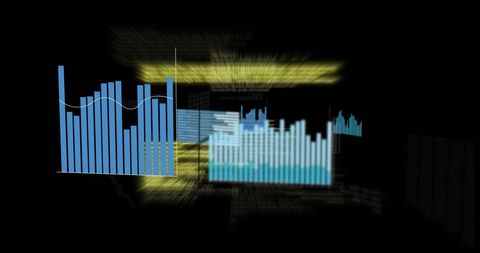
- 3D Violet Bar Chart with Data Analytics and Network Visualization
3D Violet Bar Chart with Data Analytics and Network Visualization Image

This illustration features a 3D bar chart in violet, with numeric labels on each bar representing measurements or data points. A network-like mesh with connecting lines forms the background, symbolizing data connections and technological advances. Ideal for use in tech presentations, data analysis reports, or futuristic visual concepts, this design demonstrates a blend of technology, data processing, and detailed measurement processes.

downloads
Tags:
More
Credit Photo
If you would like to credit the Photo, here are some ways you can do so
Text Link
photo Link
<span class="text-link">
<span>
<a target="_blank" href=https://pikwizard.com/photo/3d-violet-bar-chart-with-data-analytics-and-network-visualization/cd5f4dbb97eba1fd20ae98f0eaba4cba/>PikWizard</a>
</span>
</span>
<span class="image-link">
<span
style="margin: 0 0 20px 0; display: inline-block; vertical-align: middle; width: 100%;"
>
<a
target="_blank"
href="https://pikwizard.com/photo/3d-violet-bar-chart-with-data-analytics-and-network-visualization/cd5f4dbb97eba1fd20ae98f0eaba4cba/"
style="text-decoration: none; font-size: 10px; margin: 0;"
>
<img src="https://pikwizard.com/pw/medium/cd5f4dbb97eba1fd20ae98f0eaba4cba.jpg" style="margin: 0; width: 100%;" alt="" />
<p style="font-size: 12px; margin: 0;">PikWizard</p>
</a>
</span>
</span>
Free (free of charge)
Free for personal and commercial use.
Author: Creative Art