- Home >
- Stock Photos >
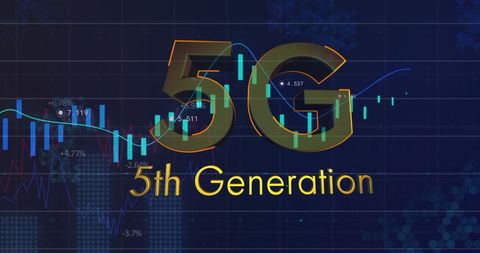
- 5G Technology Unlocking New Financial Data Horizons
5G Technology Unlocking New Financial Data Horizons Image
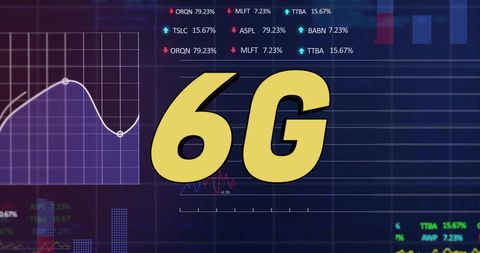
Digitally generated concept illustrating 5G technology with financial data visualization in a futuristic style. Perfect for use in articles about technology innovation, business analytics, and the impact of new communication networks on global economics.
Powered by 


2
downloads
downloads
Tags:
More
Credit Photo
If you would like to credit the Photo, here are some ways you can do so
Text Link
photo Link
<span class="text-link">
<span>
<a target="_blank" href=https://pikwizard.com/photo/5g-technology-unlocking-new-financial-data-horizons/89f99cdc25f09ae23b9790a7dcf198c4/>PikWizard</a>
</span>
</span>
<span class="image-link">
<span
style="margin: 0 0 20px 0; display: inline-block; vertical-align: middle; width: 100%;"
>
<a
target="_blank"
href="https://pikwizard.com/photo/5g-technology-unlocking-new-financial-data-horizons/89f99cdc25f09ae23b9790a7dcf198c4/"
style="text-decoration: none; font-size: 10px; margin: 0;"
>
<img src="https://pikwizard.com/pw/medium/89f99cdc25f09ae23b9790a7dcf198c4.jpg" style="margin: 0; width: 100%;" alt="" />
<p style="font-size: 12px; margin: 0;">PikWizard</p>
</a>
</span>
</span>
Free (free of charge)
Free for personal and commercial use.
Author: Creative Art
Similar Free Stock Images
Loading...

Premium


Premium


Premium


Premium


Premium


Premium


Premium

Premium

Premium


Premium

Premium


Premium

Premium


Premium


Premium

Premium

Premium


Premium


Premium


Premium