- Home >
- Stock Photos >
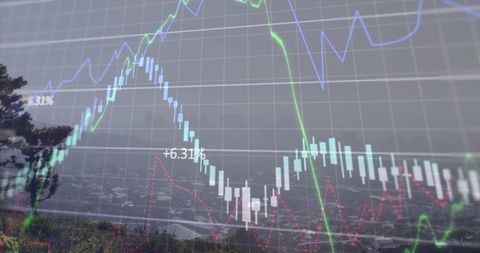
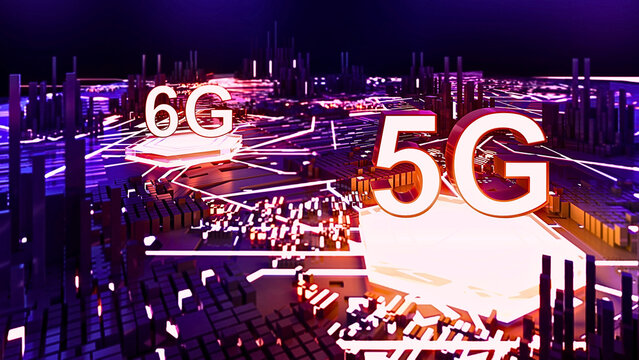
- 6G Network Concept with Financial Graph Interface
6G Network Concept with Financial Graph Interface Image
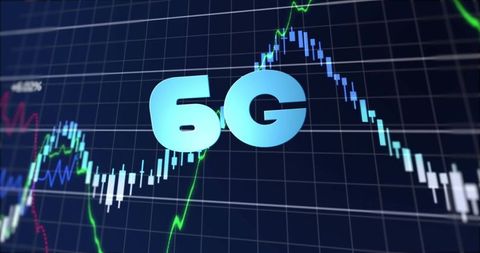
Representation of 6G integration with financial and digital sectors, showing complex data analysis through candlestick bars and graphs. Useful for illustrating the future of connectivity and data management in technology and financial industries.
Powered by 


downloads
Tags:
More
Credit Photo
If you would like to credit the Photo, here are some ways you can do so
Text Link
photo Link
<span class="text-link">
<span>
<a target="_blank" href=https://pikwizard.com/photo/6g-network-concept-with-financial-graph-interface/c61ff1a8331bb884673608753b6c451e/>PikWizard</a>
</span>
</span>
<span class="image-link">
<span
style="margin: 0 0 20px 0; display: inline-block; vertical-align: middle; width: 100%;"
>
<a
target="_blank"
href="https://pikwizard.com/photo/6g-network-concept-with-financial-graph-interface/c61ff1a8331bb884673608753b6c451e/"
style="text-decoration: none; font-size: 10px; margin: 0;"
>
<img src="https://pikwizard.com/pw/medium/c61ff1a8331bb884673608753b6c451e.jpg" style="margin: 0; width: 100%;" alt="" />
<p style="font-size: 12px; margin: 0;">PikWizard</p>
</a>
</span>
</span>
Free (free of charge)
Free for personal and commercial use.
Author: Authentic Images