- Home >
- Stock Photos >
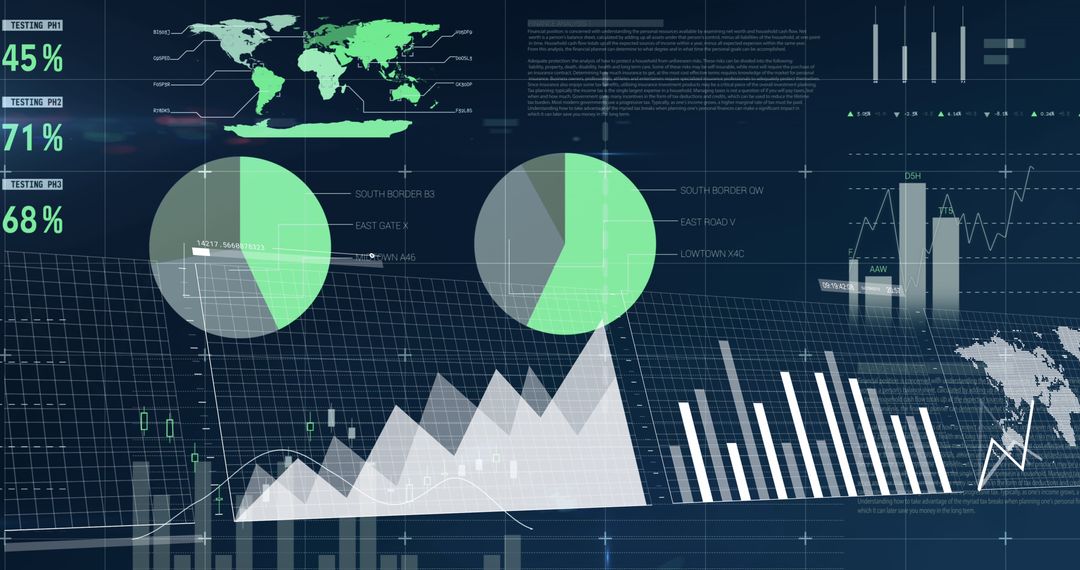
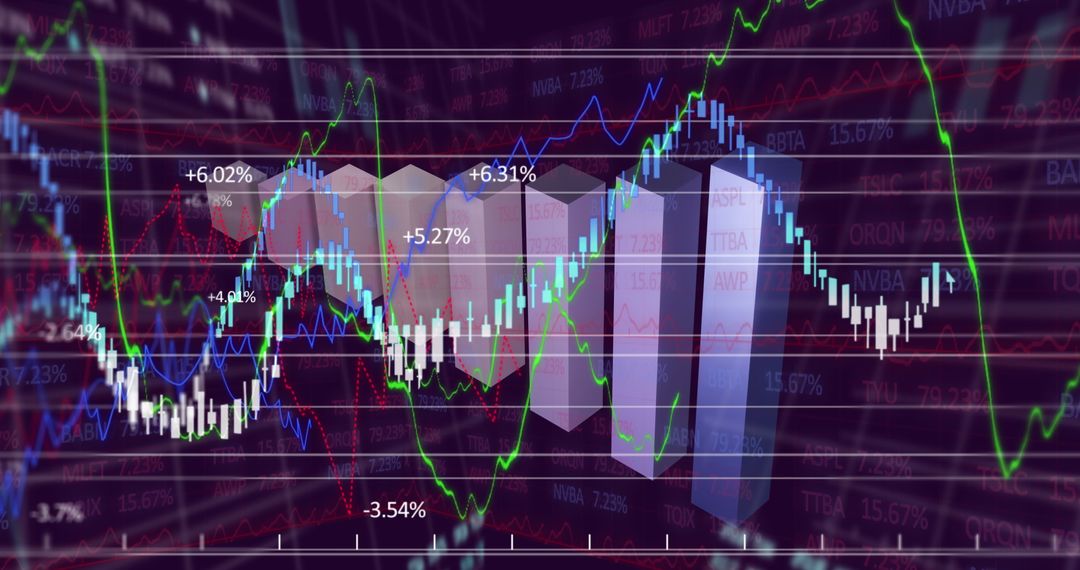
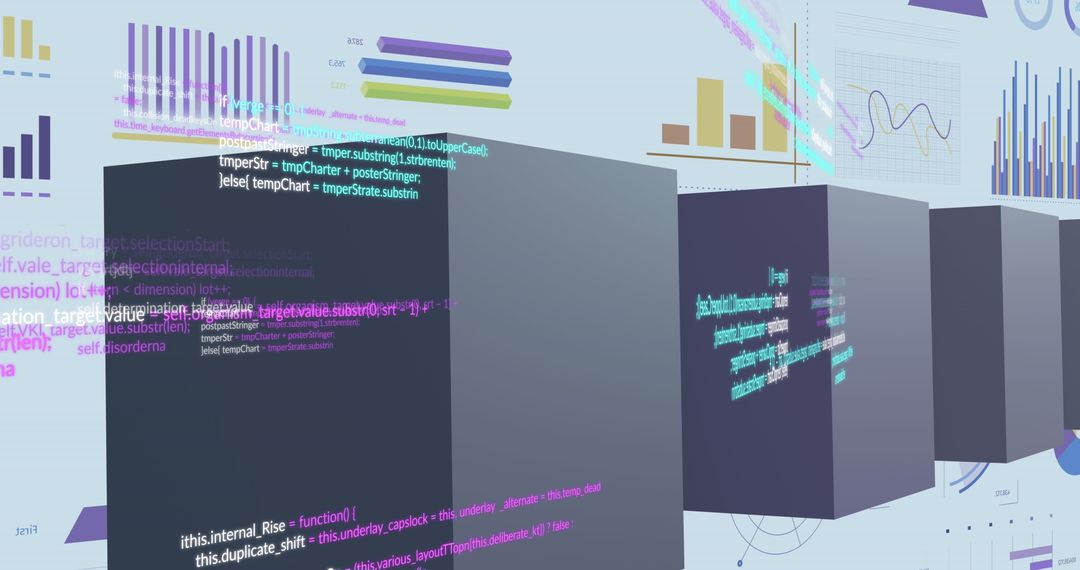
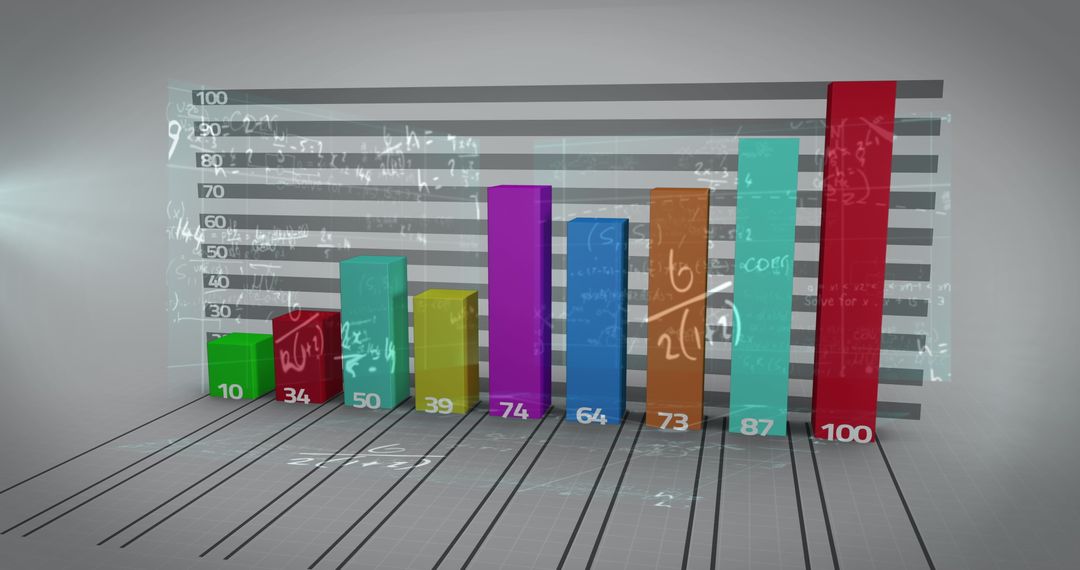
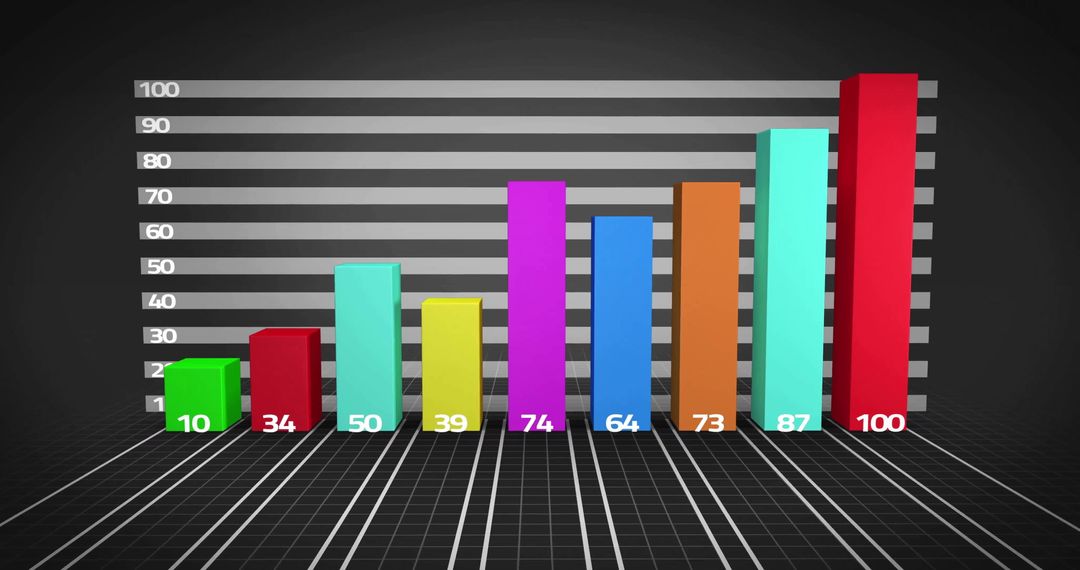
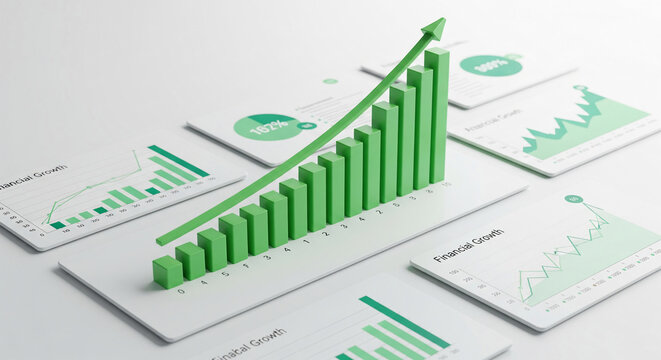
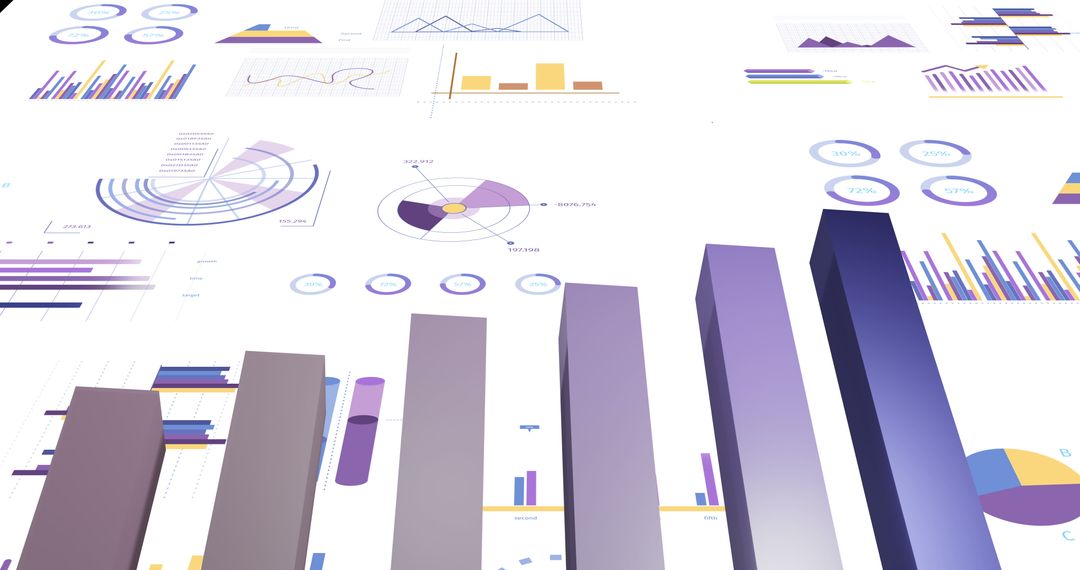
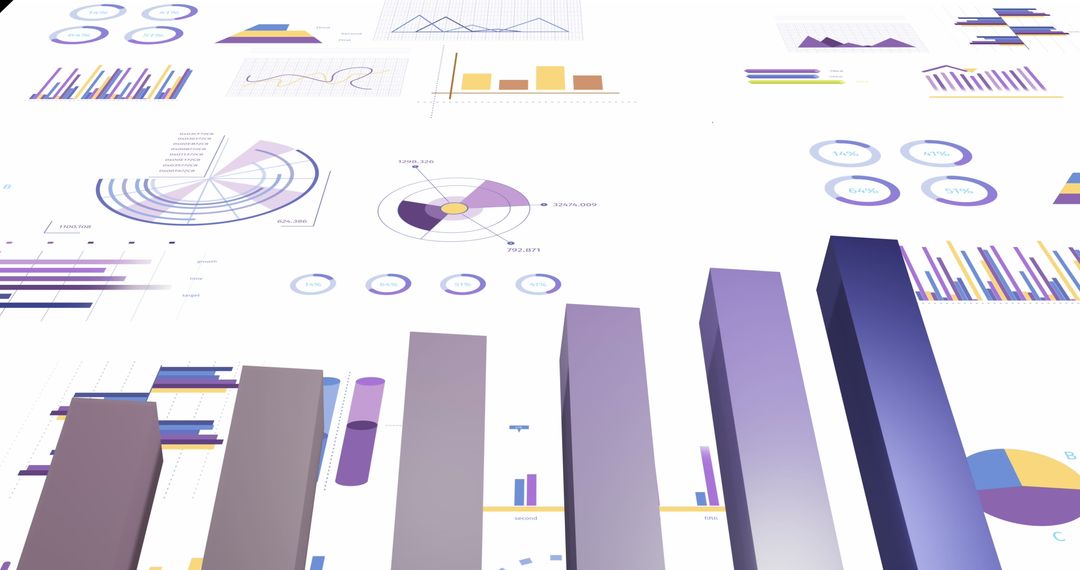
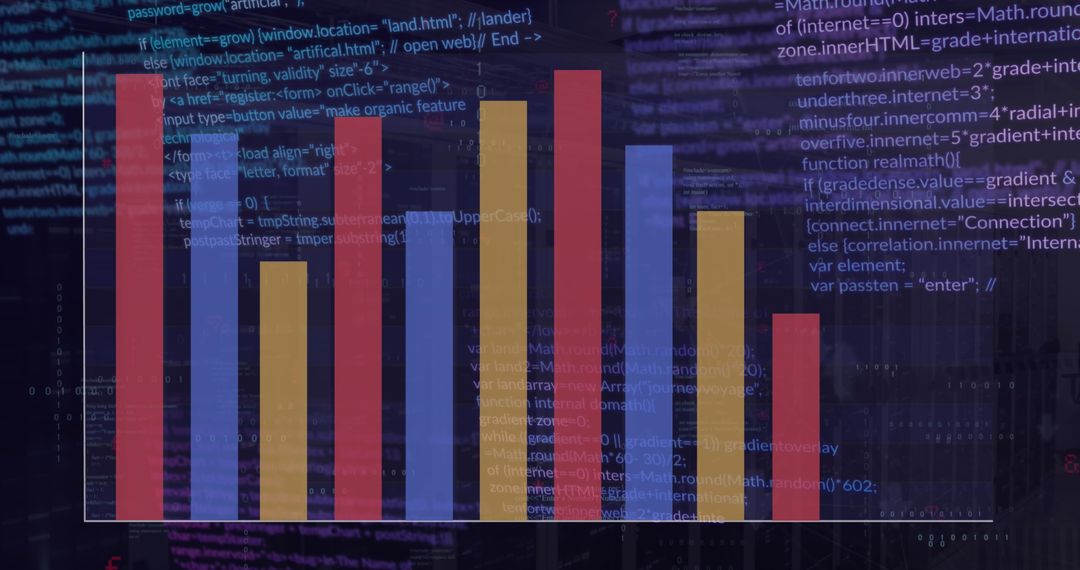
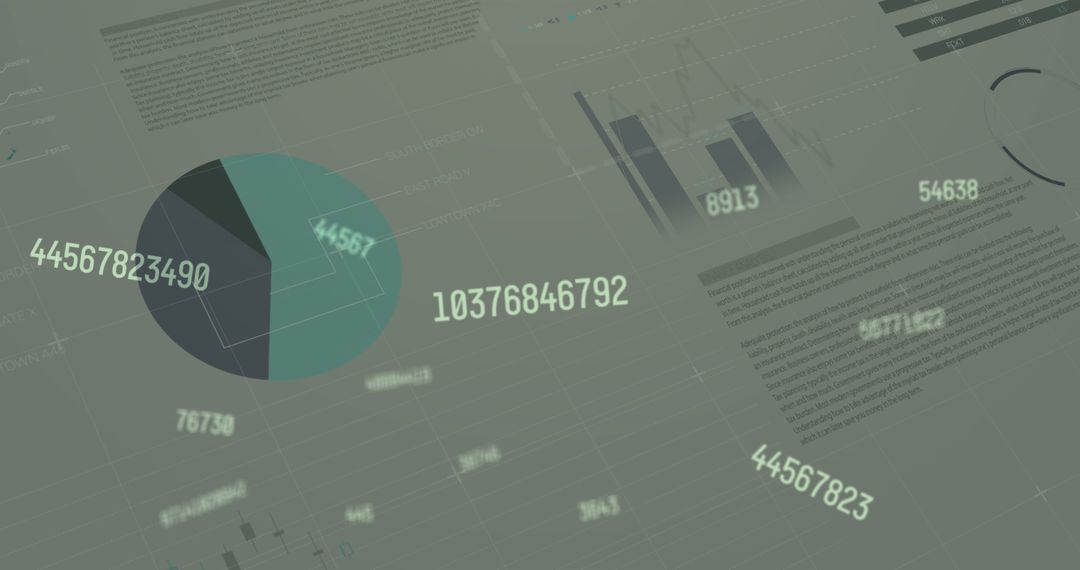
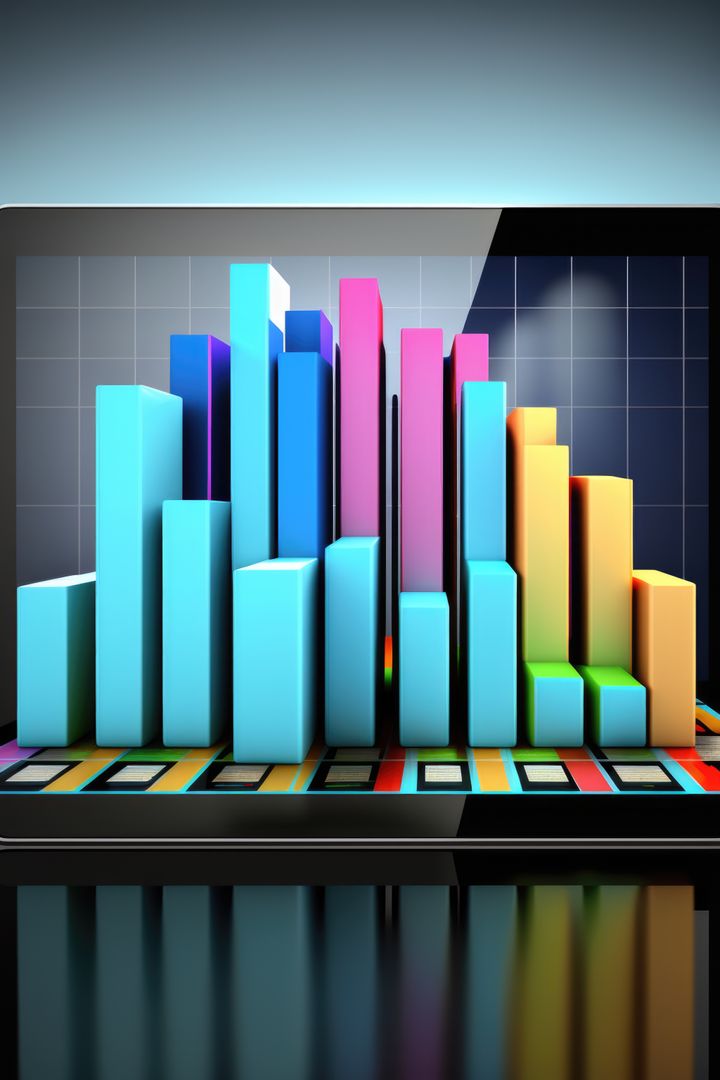
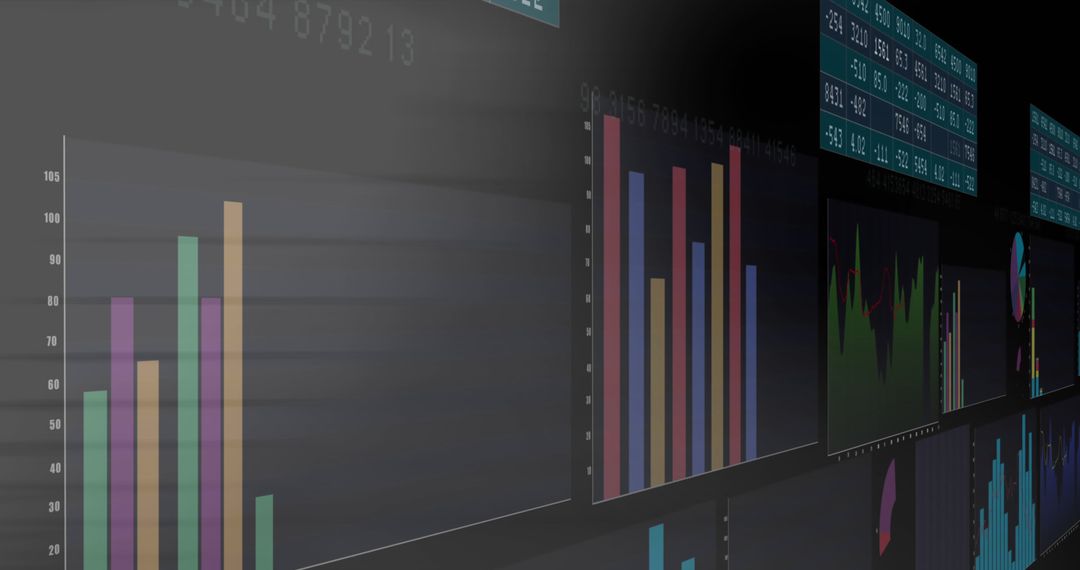
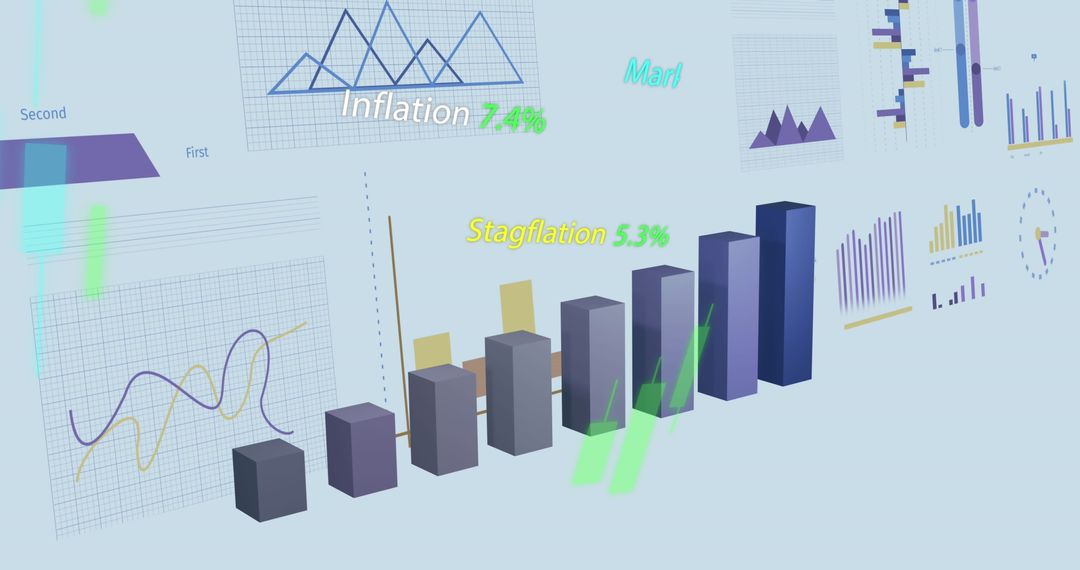
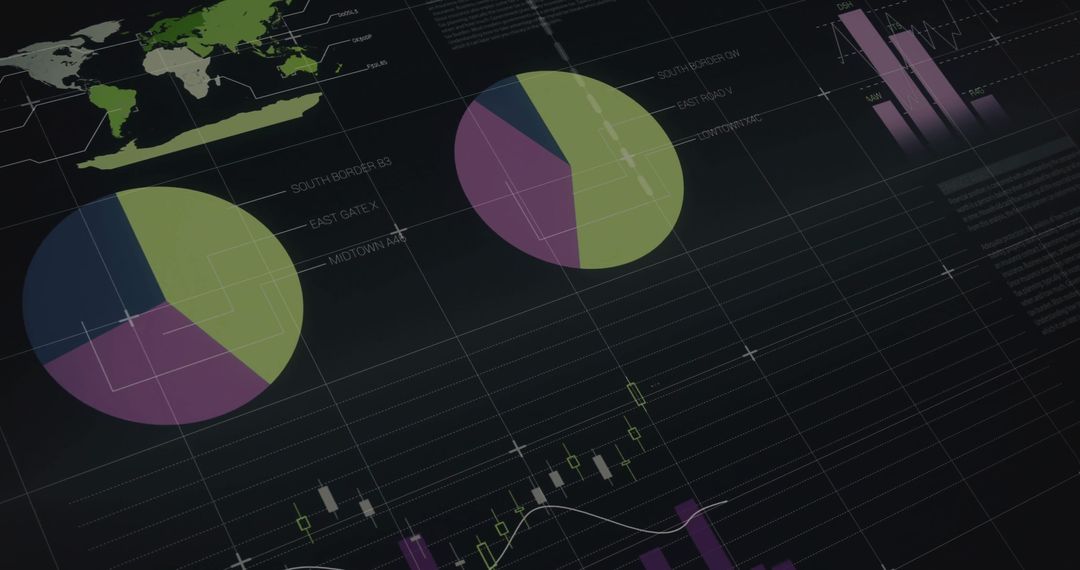
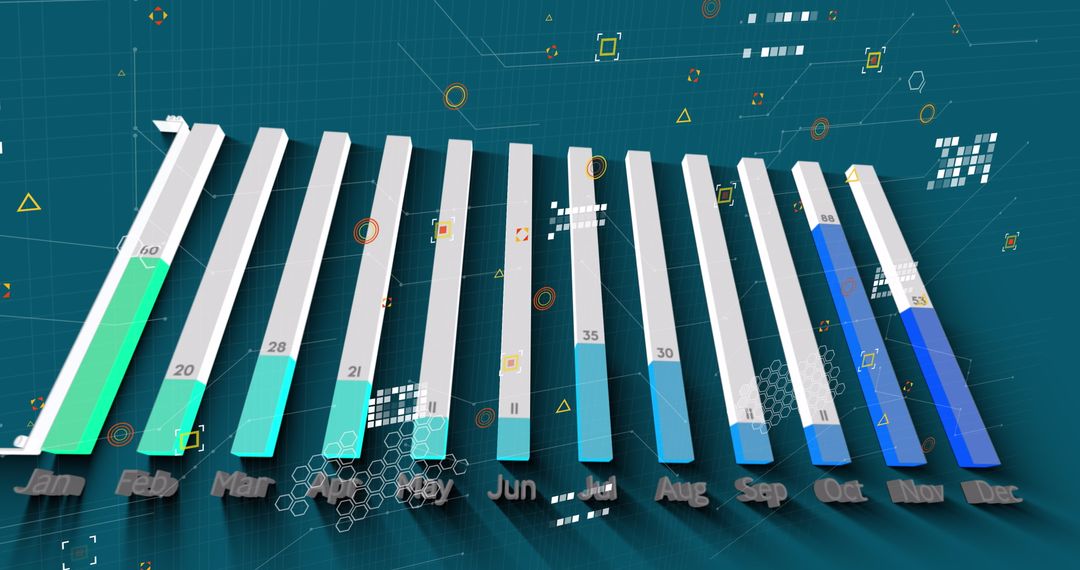
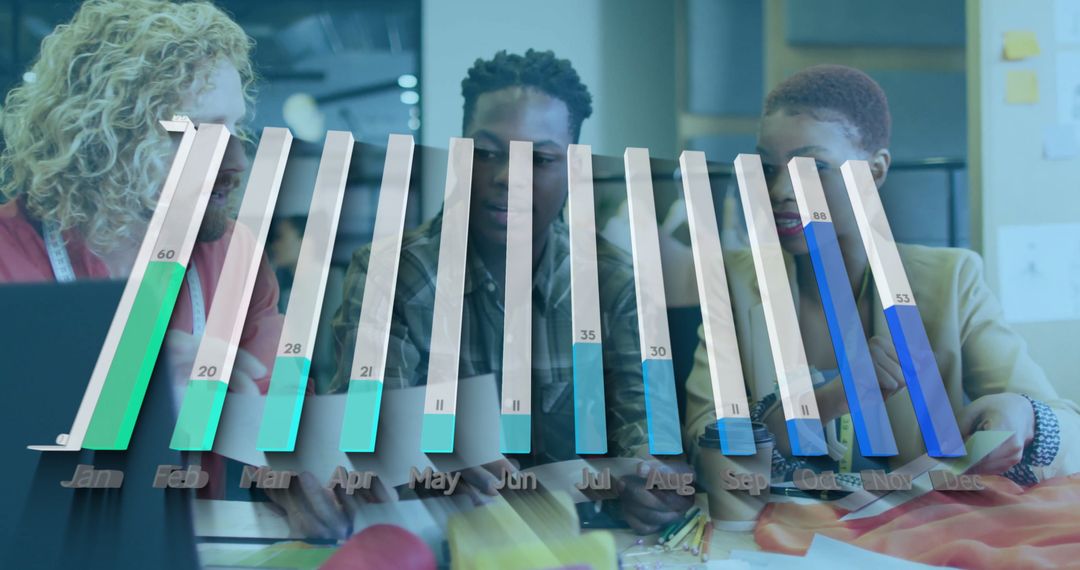
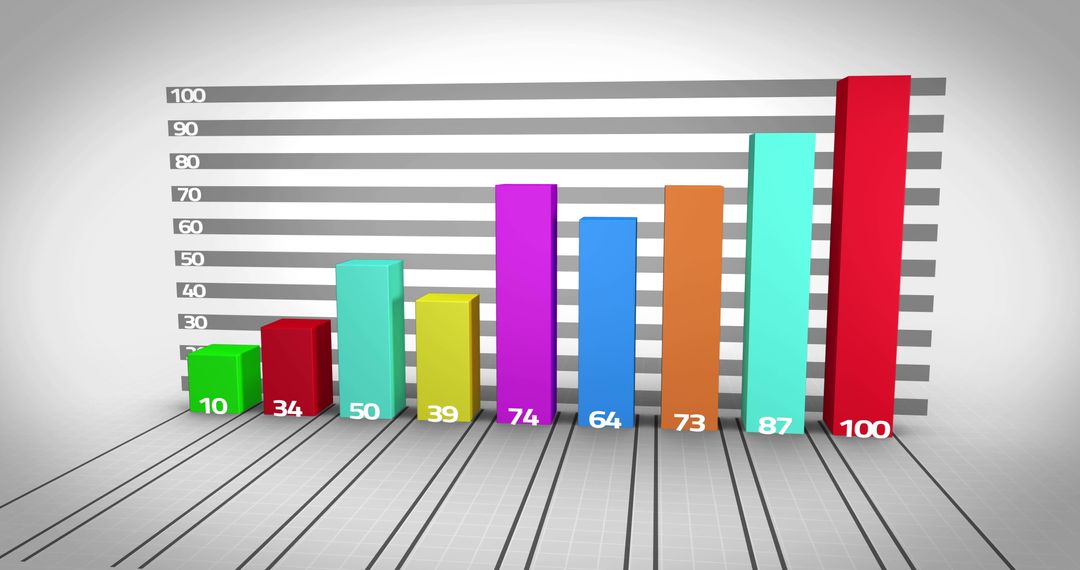
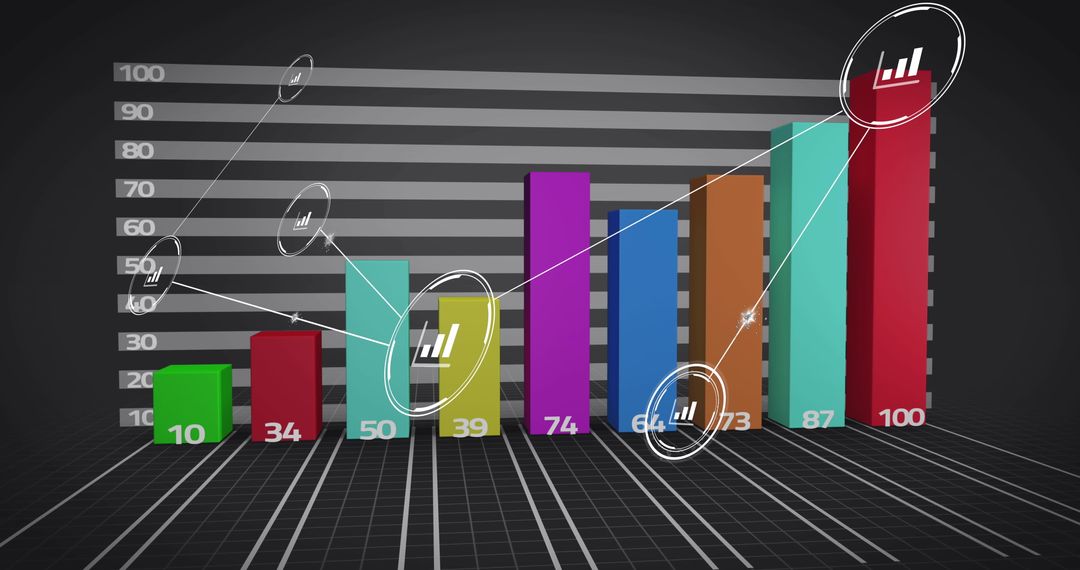
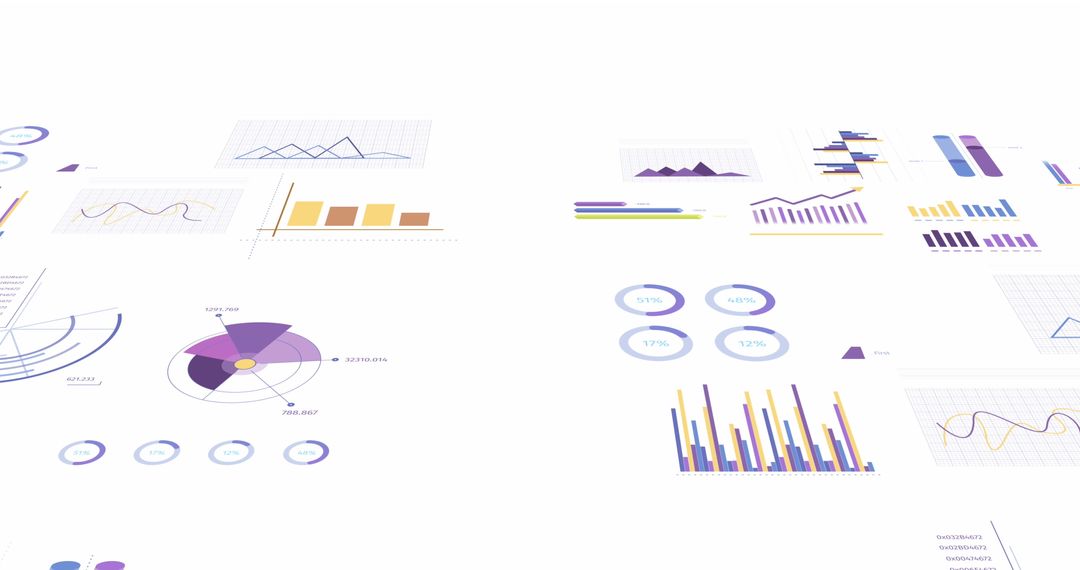
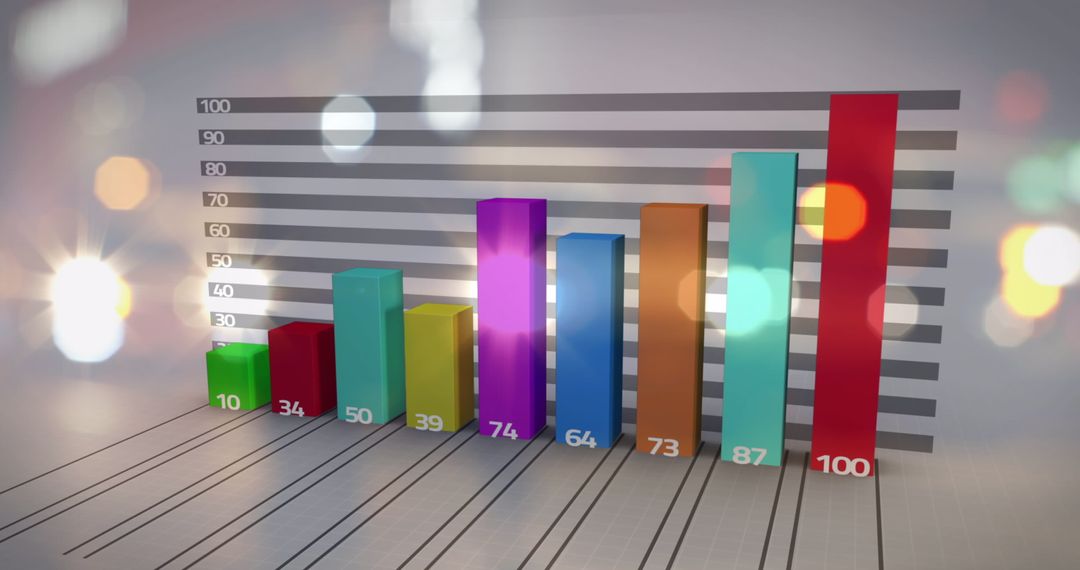
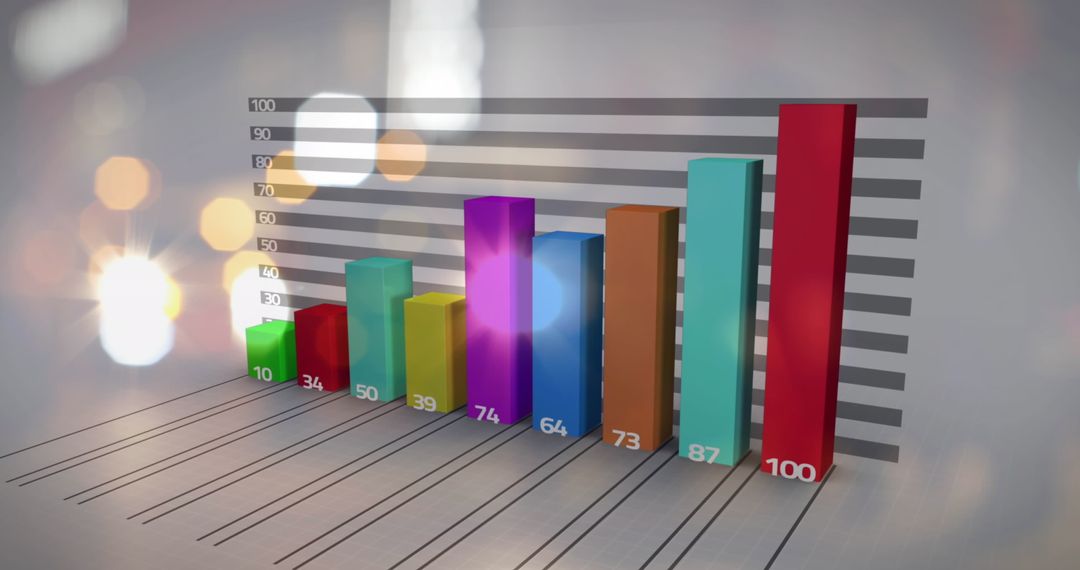
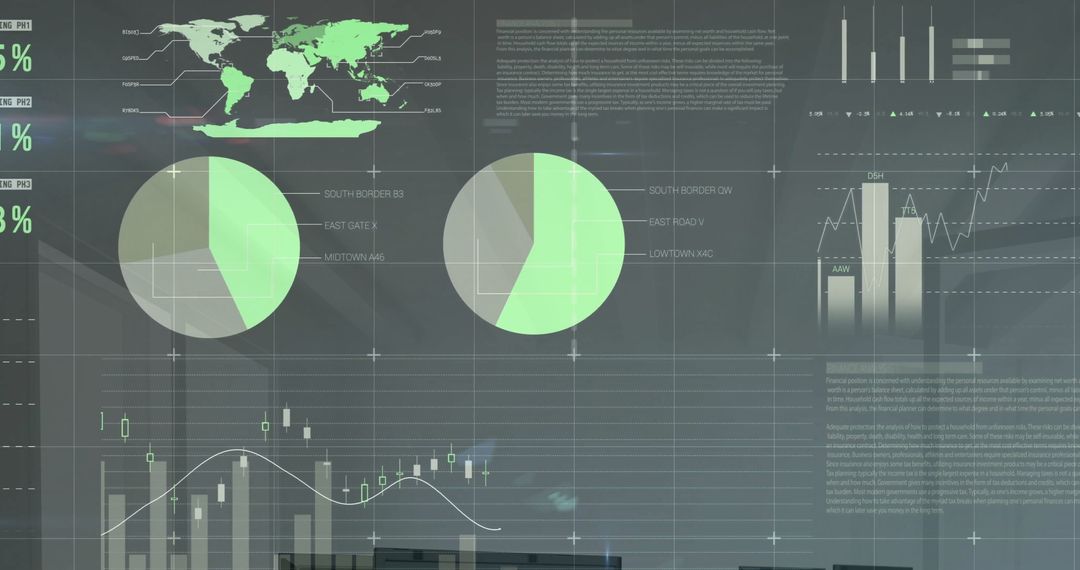
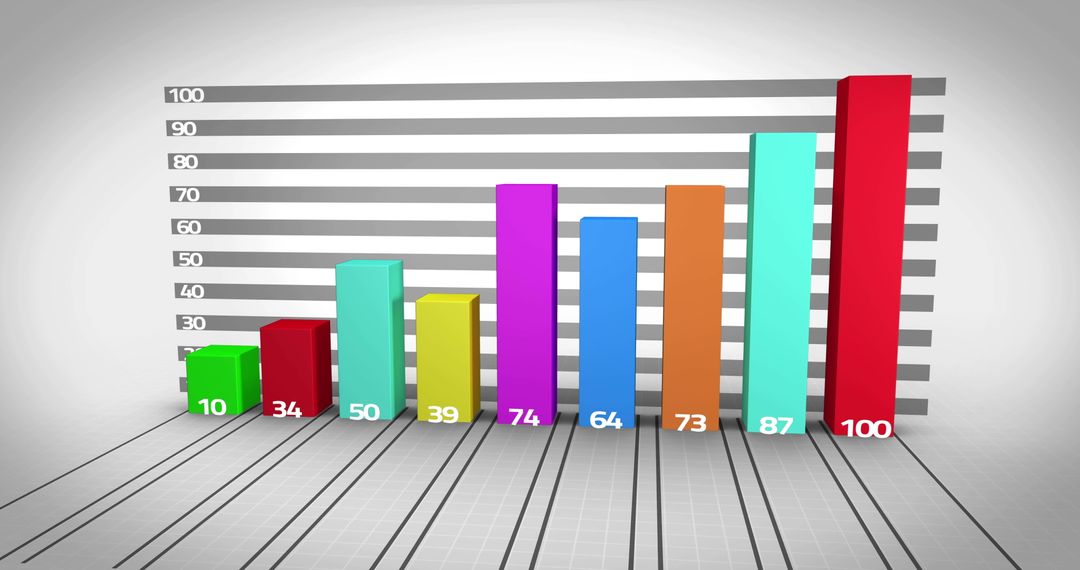
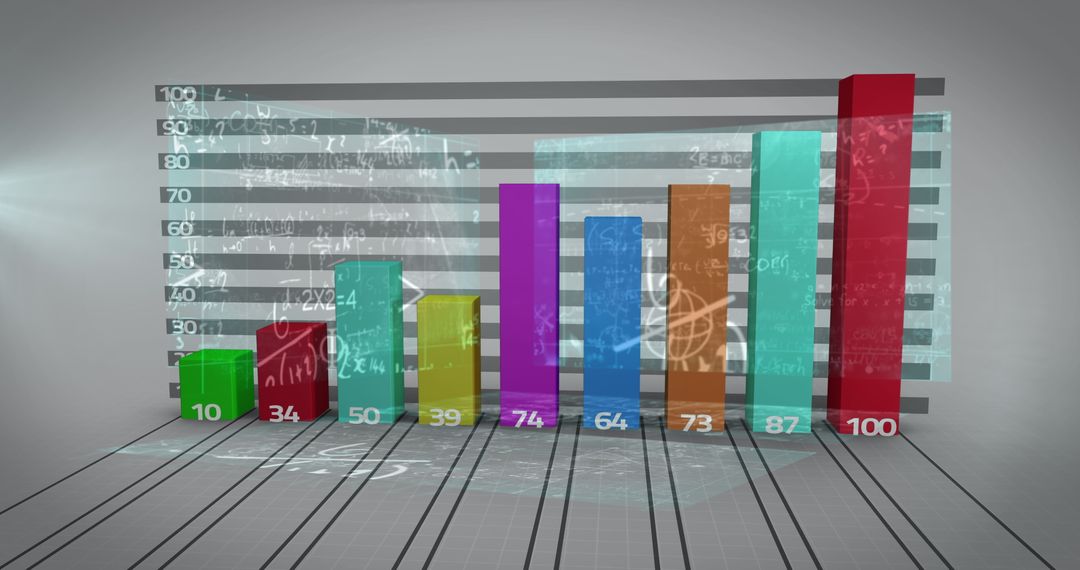
- Abstract 3D Bar Chart Overlaid with Financial Graphs
Abstract 3D Bar Chart Overlaid with Financial Graphs Image

This image portrays an abstract three-dimensional bar chart surrounded by digital financial graphs and statistical data. It symbolizes financial analysis, business growth, and technological progress in data handling. Ideal for use in financial reports, business presentations, websites dedicated to economic analyses, or articles about technology in finance.
Powered by 


0
downloads
downloads
Tags:
More
Credit Photo
If you would like to credit the Photo, here are some ways you can do so
Text Link
photo Link
<span class="text-link">
<span>
<a target="_blank" href=https://pikwizard.com/photo/abstract-3d-bar-chart-overlaid-with-financial-graphs/123ad7f02058d129a3b24601f0a3c152/>PikWizard</a>
</span>
</span>
<span class="image-link">
<span
style="margin: 0 0 20px 0; display: inline-block; vertical-align: middle; width: 100%;"
>
<a
target="_blank"
href="https://pikwizard.com/photo/abstract-3d-bar-chart-overlaid-with-financial-graphs/123ad7f02058d129a3b24601f0a3c152/"
style="text-decoration: none; font-size: 10px; margin: 0;"
>
<img src="https://pikwizard.com/pw/medium/123ad7f02058d129a3b24601f0a3c152.jpg" style="margin: 0; width: 100%;" alt="" />
<p style="font-size: 12px; margin: 0;">PikWizard</p>
</a>
</span>
</span>
Free (free of charge)
Free for personal and commercial use.
Author: Authentic Images
Similar Free Stock Images

Premium


Premium


Premium


Premium


Premium


Premium


Premium


Premium

Premium


Premium


Premium


Premium


Premium


Premium


Premium


Premium


Premium


Premium


Premium


Premium


Premium


Premium


Premium


Premium