- Home >
- Stock Photos >
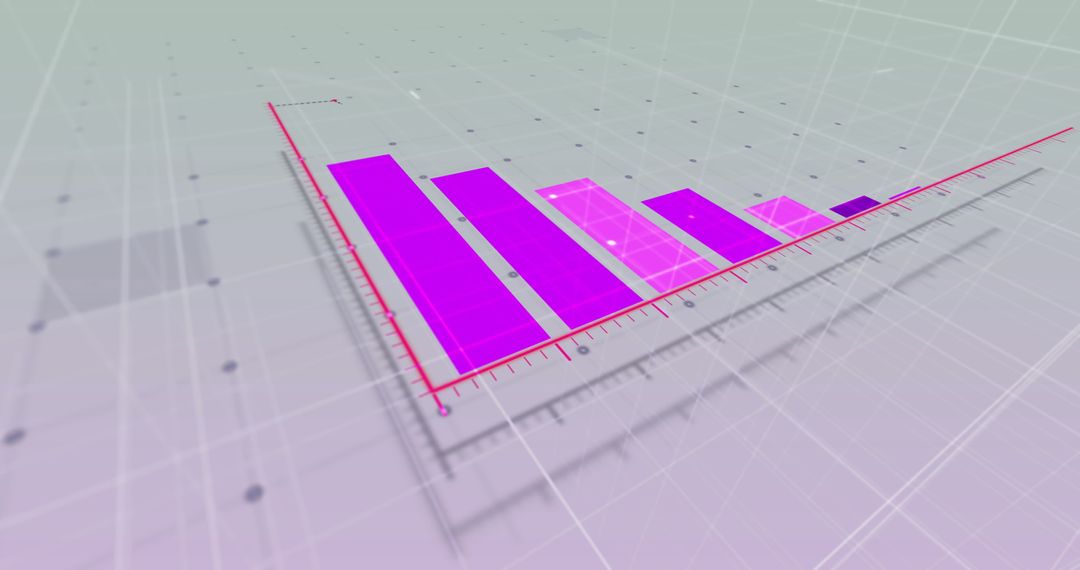
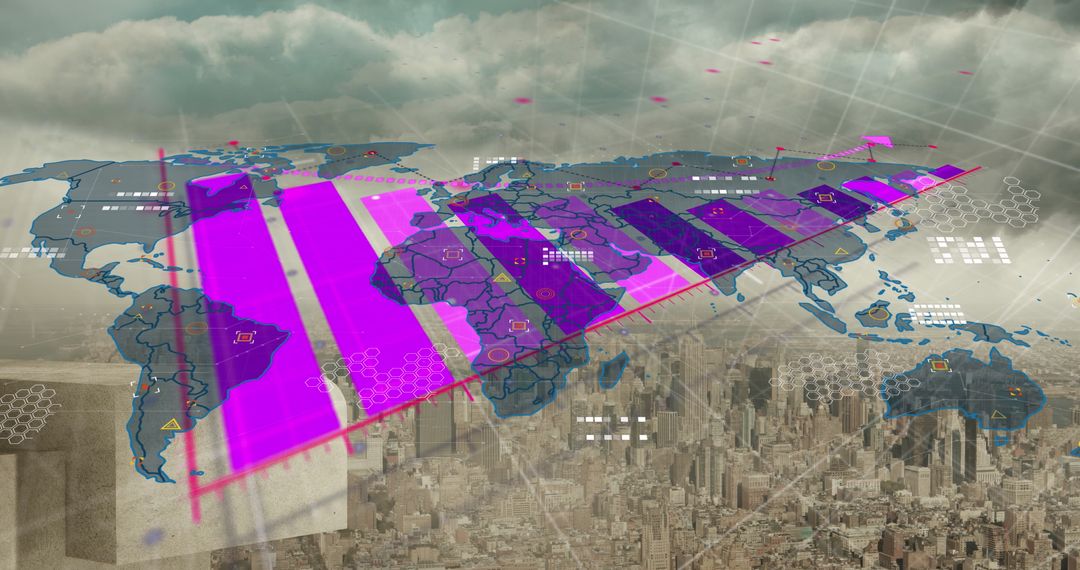
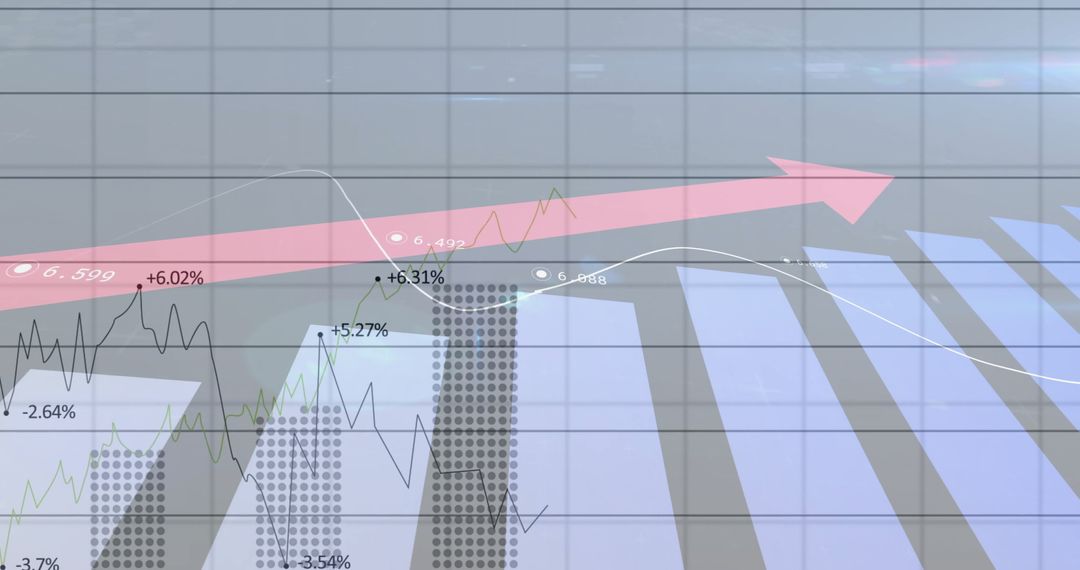
- Abstract 3D Bar Chart with Rising Trend and Connected Grid
Abstract 3D Bar Chart with Rising Trend and Connected Grid Image

Dynamic 3D bar chart displaying a positive upward trend with a grid of connective networks. Suitable for illustrating concepts in business analytics, financial growth, technological advancements or modern digital communication. Bonus engage potential with vibrant magenta and teal colors symbolizing innovation and progressive growth in market prospects.
Powered by  - Get 15% off with code: PIKWIZARD15


0
downloads
downloads
Tags:
More
Credit Photo
If you would like to credit the Photo, here are some ways you can do so
Text Link
photo Link
<span class="text-link">
<span>
<a target="_blank" href=https://pikwizard.com/photo/abstract-3d-bar-chart-with-rising-trend-and-connected-grid/a077f2db1361cf908321228a93daaa3d/>PikWizard</a>
</span>
</span>
<span class="image-link">
<span
style="margin: 0 0 20px 0; display: inline-block; vertical-align: middle; width: 100%;"
>
<a
target="_blank"
href="https://pikwizard.com/photo/abstract-3d-bar-chart-with-rising-trend-and-connected-grid/a077f2db1361cf908321228a93daaa3d/"
style="text-decoration: none; font-size: 10px; margin: 0;"
>
<img src="https://pikwizard.com/pw/medium/a077f2db1361cf908321228a93daaa3d.jpg" style="margin: 0; width: 100%;" alt="" />
<p style="font-size: 12px; margin: 0;">PikWizard</p>
</a>
</span>
</span>
Free (free of charge)
Free for personal and commercial use.
Author: Awesome Content
Similar Free Stock Images

Premium


Premium


Premium


Premium


Premium


Premium


Premium


Premium


Premium


Premium


Premium


Premium


Premium


Premium


Premium


Premium


Premium


Premium


Premium


Premium


Premium


Premium


Premium


Premium