
- Home >
- Stock Photos >
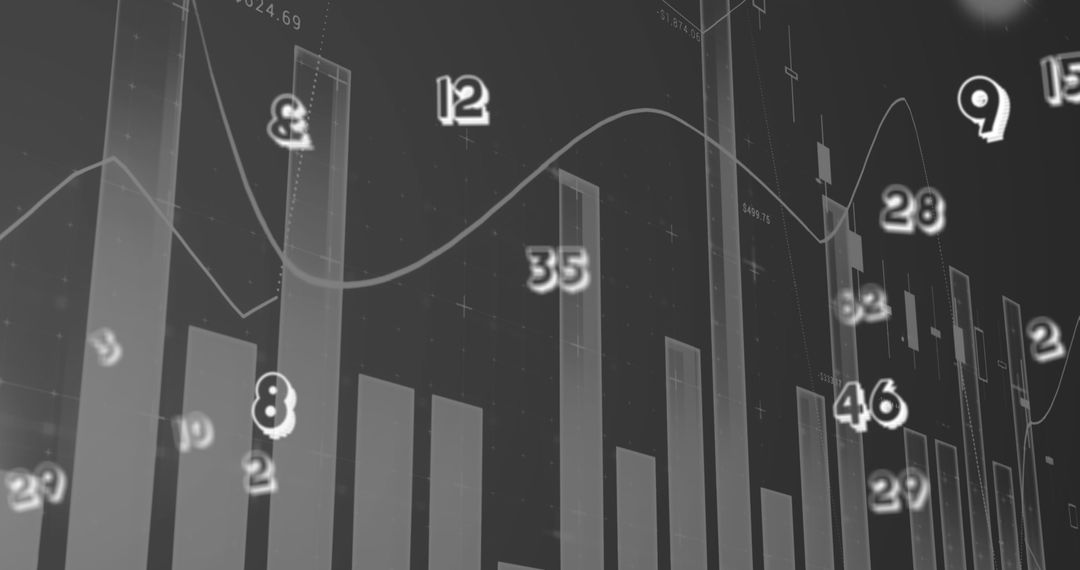
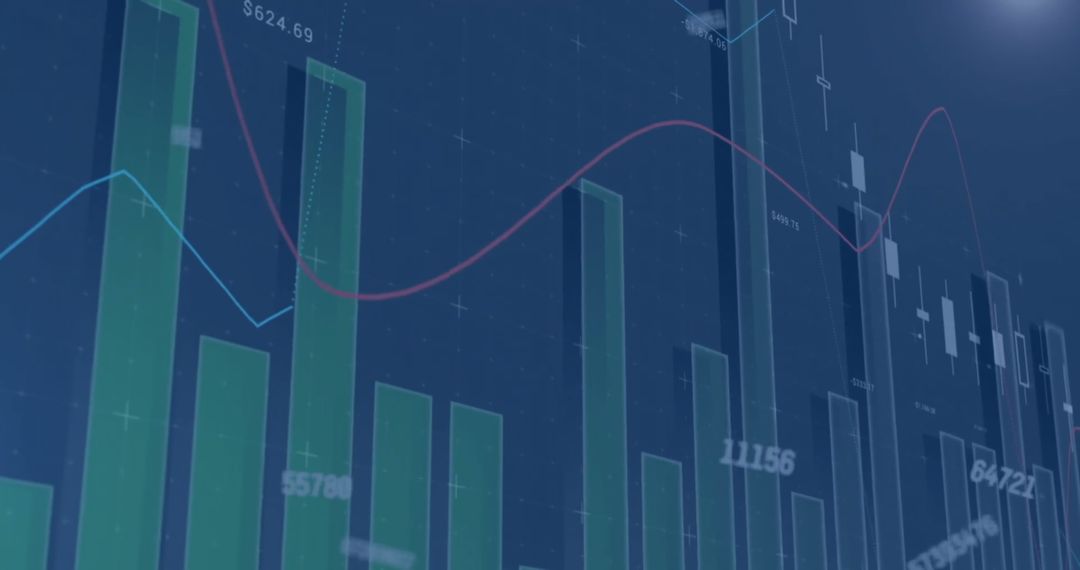
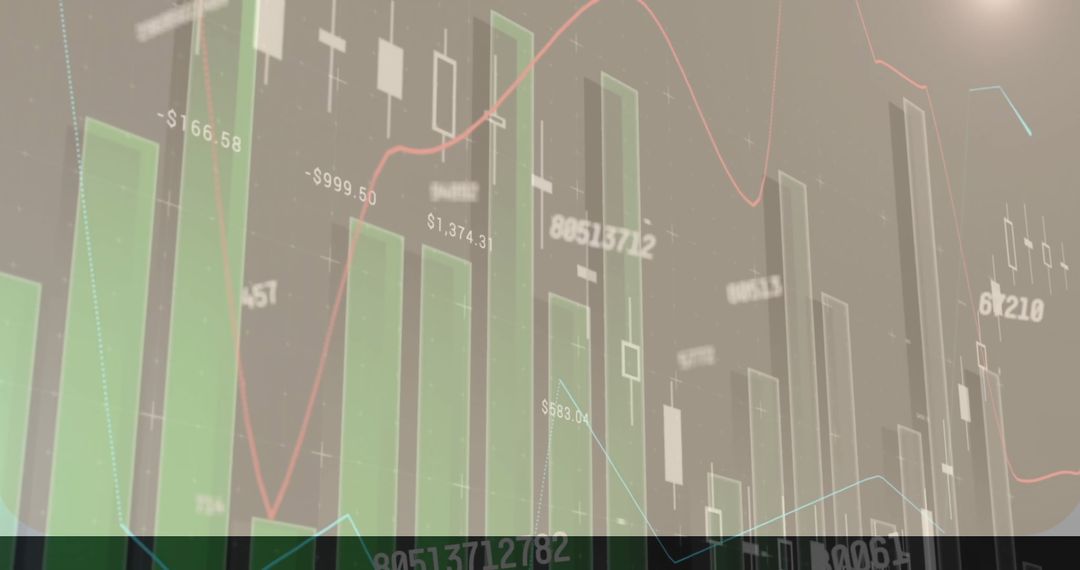
- Abstract 3D Financial Graphics with Data and Charts
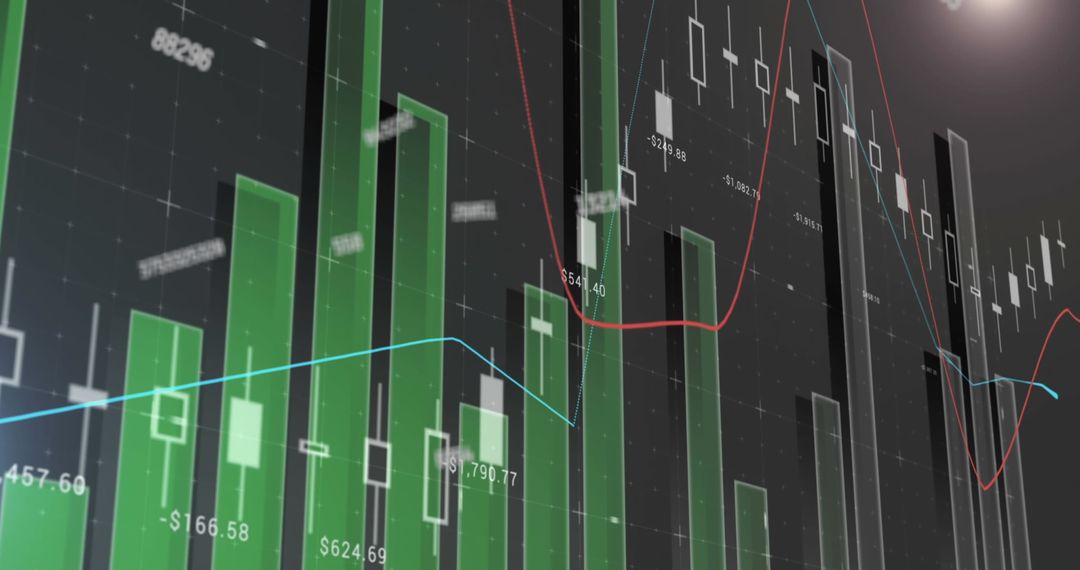
Abstract 3D Financial Graphics with Data and Charts Image

The visual features abstract graphics representing financial data and charts in a digital and futuristic style. Numbers and graphs are highlighted over a gray background, suggesting analysis and reporting in finance or business settings. This image is useful for illustrating concepts related to market trends, economic growth, investment analysis, and financial reporting. It can be utilised in a business presentation, financial report, or educational material focusing on data analysis and economic forecasts.
Powered by  - Get 15% off with code: PIKWIZARD15


2
downloads
downloads
Tags:
More
Credit Photo
If you would like to credit the Photo, here are some ways you can do so
Text Link
photo Link
<span class="text-link">
<span>
<a target="_blank" href=https://pikwizard.com/photo/abstract-3d-financial-graphics-with-data-and-charts/055e232f029dd0baa10ee1b88330796c/>PikWizard</a>
</span>
</span>
<span class="image-link">
<span
style="margin: 0 0 20px 0; display: inline-block; vertical-align: middle; width: 100%;"
>
<a
target="_blank"
href="https://pikwizard.com/photo/abstract-3d-financial-graphics-with-data-and-charts/055e232f029dd0baa10ee1b88330796c/"
style="text-decoration: none; font-size: 10px; margin: 0;"
>
<img src="https://pikwizard.com/pw/medium/055e232f029dd0baa10ee1b88330796c.jpg" style="margin: 0; width: 100%;" alt="" />
<p style="font-size: 12px; margin: 0;">PikWizard</p>
</a>
</span>
</span>
Free (free of charge)
Free for personal and commercial use.
Author: Creative Art
Similar Free Stock Images
Premium


Premium


Premium


Premium


Premium


Premium


Premium


Premium


Premium


Premium


Premium


Premium


Premium


Premium


Premium


Premium


Premium


Premium


Premium


Premium


Premium


Premium


Premium


Premium

