1. Home > 
  2. Stock Photos > 
  3. Abstract Bitcoin Price Trends with Data Grids in Orange Gradient

Abstract Bitcoin Price Trends with Data Grids in Orange Gradient Image

Abstract Bitcoin Price Trends with Data Grids in Orange Gradient

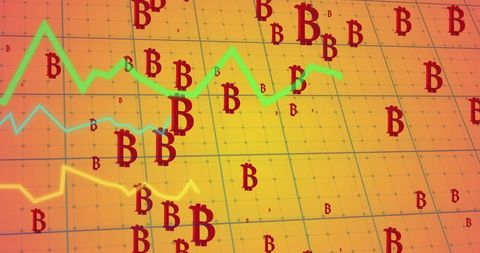
Graphical representation of Bitcoin market trends shows data on a grid with various line graphs. Ideal for use in discussions about cryptocurrency trading, financial analyses, investment strategies, or tech-related articles. Visual focuses on financial fluctuation, suitable for business promotions or educational content about digital currency.

Powered by Shutterstock logo - Get 15% off with code: PIKWIZARD15
Two diverse crypto traders brokers stock exchange market investors discussing trading charts research reports growth using pc computer looking at screen analyzing invest strategy, financial risks. - Powered by Shutterstock - Get 15% off with code: PIKWIZARD15Stockmarket online trading chart candlestick on crypto currency platform. Stock exchange financial market price candles graph data pattern analysis concept. Computer screen closeup background - Powered by Shutterstock - Get 15% off with code: PIKWIZARD15Financial advisor explaining invest stock market data consulting investor. Two busy business men analysts doing finance trading analysis pointing at exchange chart on laptop screen working in office. - Powered by Shutterstock - Get 15% off with code: PIKWIZARD15Investors analyze the data stock market index via smartphone screen to trade the stock chart for planning investments take profit, trade stock exchange market and cryptocurrency data, financial. - Powered by Shutterstock - Get 15% off with code: PIKWIZARD15Young indian business man trader wearing glasses looking at computer screen with trading charts reflecting in eyeglasses watching stock trading market financial data growth concept, close up. - Powered by Shutterstock - Get 15% off with code: PIKWIZARD15

Credit Photo

If you would like to credit the Photo, here are some ways you can do so

Free (free of charge)

Free for personal and commercial use.

Author: Awesome Content

Similar Free Stock Images

Red Declining Graph on Digital Grid Display Represents Falling Markets
Premium
Business man trader investor analyst using mobile phone app analytics for cryptocurrency financial market analysis, trading data index chart graph on smartphone and laptop screen. Over shoulder view
Analyzing Graph Showing Market Economy Stock Crisis
World Map with Falling Line Graphs Indicating Global Economic Decline
Digital Dashboard Showing Financial Analysis with Graphs
Analyzing Financial Graphs with Colorful Chart Lines
Premium
Composite collage picture of black white colors arms hold magnifier lens glass enlarge graphics paper isolated on painted background
Falling Stock Market Graph with Data on Black Screen
Digital Financial Data Overlay on Solar Energy Concept
Green Line Rising on Digital Trading Board with Abstract Background
Cryptocurrency Growth Chart Over Digital World Map
Premium
Diverse managers traders analysts discussing financial growth market at desk with laptop with graphs on screen using tablet device. Investors brokers analysing indexes online cryptocurrency stock.
Digital Financial Data Visualization on Grid Display
Digital Financial Data and Global Market Analysis on Graph
Data Analysis and Cybersecurity Concept Art
Abstract Digital Data with Upward Trending Line Graph
Premium
Business man trader investor analyst using mobile phone app analytics for cryptocurrency financial stock market analysis analyze graph trading data index investment growth chart on smartphone screen.
Financial Data Graph Overlay on Modern Office Background
Financial Data Graphs and Technology Interface Background
Digital Financial Data Interfaces in Global Connection
Binary Code Financial Analytics with Rising Graph Line
Premium
Crypto trader investor broker holding finger on buy or sell button executing financial stock trade market trading order thinking of cryptocurrency or shares assets investment risks and profit concept.
Dynamic Data Visualization with Virtual Graphs and Numbers
Colorful Line Graphs Displaying Data Over City Skyline
Digital Financial Data with Graphs and Numbers Illustrations
Fluctuating Stock Market Graph with Symbols and Percentages
Premium
Close up shot of financial analysis graph chart stock exchange bitcoin cryptocurrency report on computer screen monitors and laptop on working in trading room while broker meeting in shadow behind.
Green Line Graph Depicting Sustainability and Environmental Icons
Digital Interface with Overlapping Code and Graph
Stock Market Decline Data Analysis on Dark Grid Background
Global Financial Data and Social Media Escalation Chart
Dynamic Stock Market Graphs and Tickers Displaying Performance
Dynamic Graph with Vibrant Lines on Black Background
Premium
Serious business man trader analyst looking at computer monitor, investor broker analyzing indexes, financial chart trading online investment data on cryptocurrency stock market graph on pc screen.
Global Economic Trends Highlighted on World Map with Graphs
Bitcoin Data Processing with Graphical Interface
Digital Financial Data Analytics and Economic Trends
Dynamic Stock Market Analytics with Digital Financial Graphs
Premium
Focused smart successful caucasian male stock investor, broker, sits at his work desk, uses computer and laptop, concentrated analyzes risks and prospects, rise or fall of cryptocurrency coin
Renewable Energy Market Growth Concept with Solar Panel and Data Graphs
Rising Data and Statistics on Global Map in Green Interface Design
Dynamic Investment Growth with Ecosystem of Global Currencies
Growth Trend with Green Line Overlay and Modern Cityscape
Premium
Double exposure image of coin stacks on technology financial graph background.Economy trends background for business ,financial meltdown ,Cryptocurrency digital economy.
Rising Financial Graph on Purple Background
Financial Market Chart on Digital Screen Showing Growing Trends
Dynamic Data Visualization with Financial Charts and 3D Elements
Dynamic Data Chart on Dark Digital Background
Premium
Two traders brokers stock exchange market investors discussing crypto trading charts growth using pc computer pointing at screen analyzing financial risks, investment profit forecast. Over shoulder
Bitcoin Market Trends and Analysis Visualization
Dynamic Financial Data Display with Global Networking Theme
Dynamic Chart Displaying Fluctuating Financial Data Trends
Dynamic Stock Market Graph with Data Metrics Background
Premium
Investor trader broker analyzing financial crypto stock trade market on smartphone risk digital price data in mobile app buying bank shares, doing investment strategy analysis on phone. Over shoulder.
Data Visualization on Blue Digital Interface
Dynamic Stock Market with Percentage Fluctuations
Stock Market Showing Declining Trend with Numbers and Graph
Digital Stock Market Graph with Abstract Coding Background
Premium
Two happy successful excited diverse traders investors giving high five celebrating successful stock exchange trading deal, rising crypto bull market shares growth, ipo profit victory concept.
Financial Data Visualization with Global Network Elements
Armenian Flag with Financial Graph Overlay Depicting Market Trends
Financial Chart with Dynamic Data on Black Grid
Digital Finance and Data Visualization Concept with Growing Chart
Financial Data Analysis with Vibrant Lines on Blue Background
Financial Data Analysis with Digital Grid Chart
Premium
Crypto trader investor broker holding finger using cell phone app executing financial stock trade market trading order to buy or sell cryptocurrency shares thinking of investment risks profit concept.
Futuristic Financial Graphs with Dynamic Green Line
Growth Trajectory on Angola Flag With Economic Data
Dynamic Stock Market Data with Fluctuating Graph
Data Processing Overlay on Solar Panels Reflects Green Tech Insights
Premium
Happy middle aged business man stock investor or broker, smiling mature trader or financial expert advisor at work, stockbroker portrait. Digital trade finance exchange assets investment management.
Digital Financial Data Charts and Statistics Analysis
Cybersecurity Warnings Overlaid on Financial Data and Stock Market Graph
Rising Graphs and Interactive Financial Data Analytics Background
Dynamic Digital Market Analysis with Holographic Data
Premium
Focused crypto trader analyst wearing eyeglasses working looking at computer screen reflecting in glasses analyzing online trading stock exchange market data charts. Close up eye reflection.
Dynamic Analysis of Stock Market Trends and Patterns
Dynamic Financial Data Analyzing with Graph Overlays
Financial Growth Chart with Dynamic Green Line on Grid Overlay
Abstract Digital Stock Market Trends and Charts Analysis
Premium
Young woman working at night modern office.Technical price graph and indicator, red and green candlestick chart and stock trading computer screen background. Double exposure.Wide
Red Line Indicating Market Decline on Digital Stock Market Display
Stock Market Decline Display with Falling Red Graph Line
Dynamic Financial Chart Illustrating Stock Market Volatility
Digital Montage of Statistical Data and Binary Code Elements
Premium
Crypto trader investor analyst broker using pc computer analyzing online cryptocurrency exchange stock market indexes charts investing money profit in trading platform stockmarket. Over shoulder view.
Stock Market Decline with Red Graph Showing Slump in Financial Markets
Sharp Decline in Stock Market Graph Against Red Financial Data Background
Green Graph Showing Forex Trends on Transparent Cyber Interface
Digital Finance Visualization over Bitcoin Symbols
Premium
Serious businessman thinking hard of problem solution working late in office with computers documents, thoughtful trader focused on stock trading data analysis, analyzing forecasting financial rates
Dynamic Stock Market Analysis with Digital Graph Lines
Abstract Financial Data Display with Trend Lines and Bar Charts
Dynamic Financial Data Analysis Illustration
Dynamic Financial Market Trends with Data Visualizations
Financial Data Visualization with Rising Trends
Digital Fuel Sales Analysis with Graphical Data Interface
Premium
Mature crypto trader investor analyst broker using pc computer analyzing digital cryptocurrency exchange stock market trading graphs report thinking of investing funds risks doing global analysis.
Financial Data Through Digital Networks with Stock Market Growth Trend
Dynamic Stock Market Data Display in Red and Green Ticker
Digital Finance Rising with Solar Technology and Market Data
Dynamic Graphs Over Solar Panels and Storage Battery Concept
Premium
Young business man trader analyst looking at laptop monitor on sofa, investor broker analyzing indexes, financial chart trading online investment data on cryptocurrency stock market graph. Top view
Dynamic Green Line Graph Showing Financial Data Fluctuations
Rising Green Line Chart Overlays Concept of Financial Growth
Financial Statistics Superimposed on 3D Model
Digital Lock with Real-Time Data Display
Premium
Business woman sitting front laptop computer with financial graphs and statistics on monitor. Double exposure. Wide
Dynamic Financial Growth Graph on Blue Grid Background
Neon Stadium and Data Integration in Digital Interface
Fluctuating Financial Stock Market with Digital Display
Graphical Data Analysis on Digital Interface
Premium
Stock exchange market traders investors working on financial trading charts analysis. Two happy busy business men analysts consulting on digital finance forecast using laptop in office. Copy space.
Falling Red Line on Global Stock Market Display
Dynamic Financial Graph with Growth Patterns on Digital Screen
Dynamic Financial Graphs Illustrating Business Growth
Dynamic Financial Chart with Red Line Graph on Digital Interface
Premium
Two busy business men investors doing financial trading market data analysis. Male advisor and analyst consulting about stock exchange investing pointing at chart on laptop computer working in office.
Digital Data Analytics on Blue Grid Background
Futuristic Data Trend Graphs on Digital Interface
Colorful Financial Graphs on Digital Grid Background
Dynamic Financial Data Analysis with Growth Indicators
Premium
Stressed business man crypto trader broker investor analyzing stock exchange market crypto trading decreasing chart data fall down loss, desperate about losing money of crisis, recession, inflation.
Jagged cyan line chart on dark analytics grid with filled area and numeric label 54.17