- Home >
- Stock Photos >
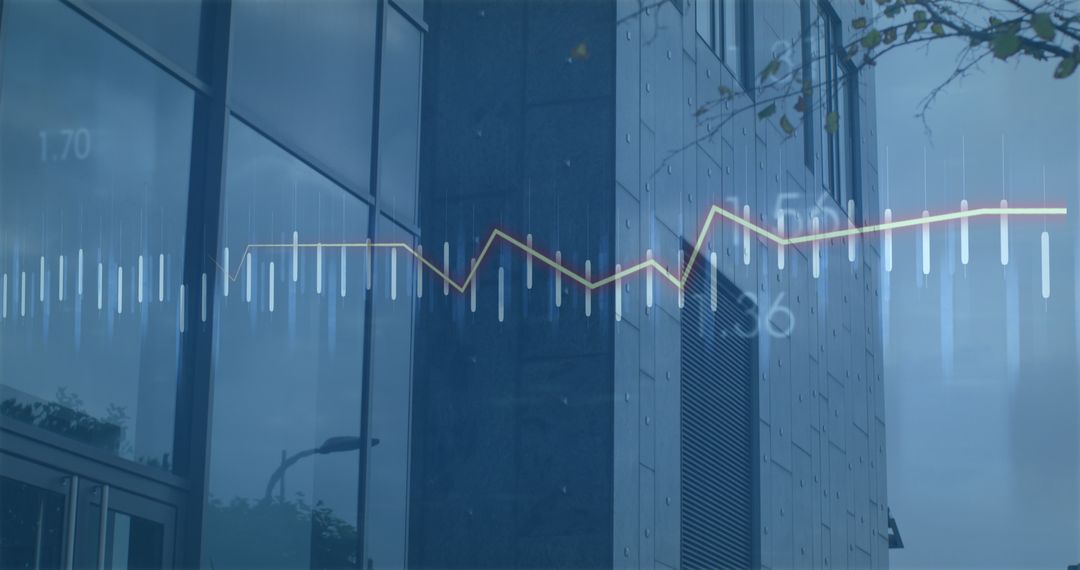
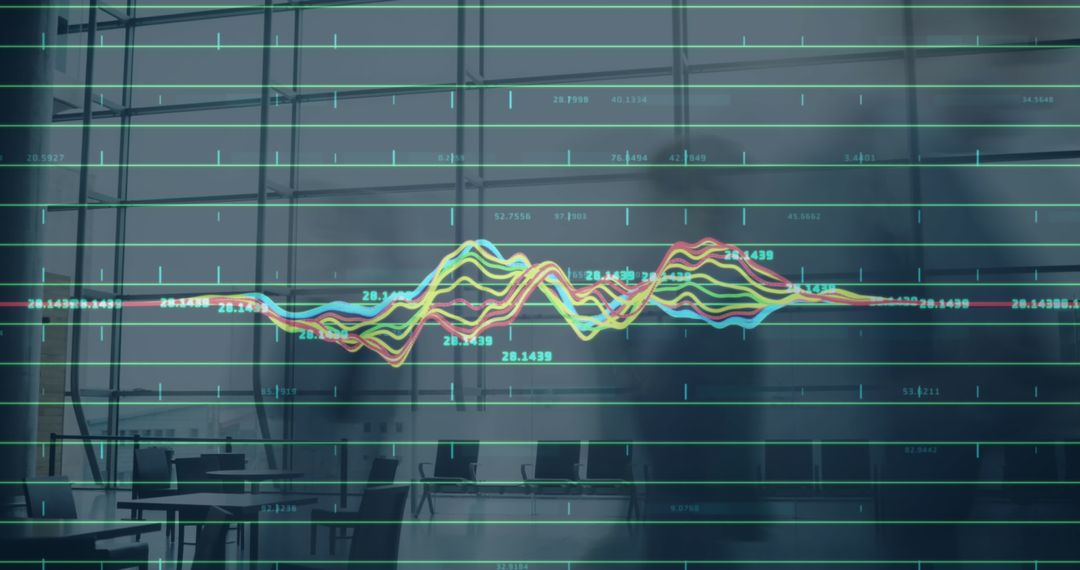
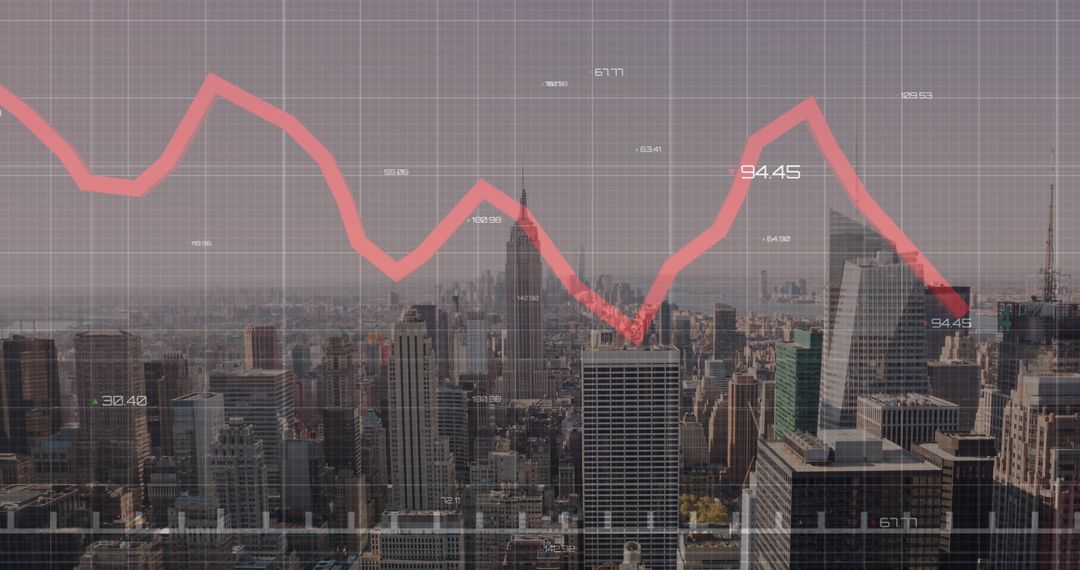
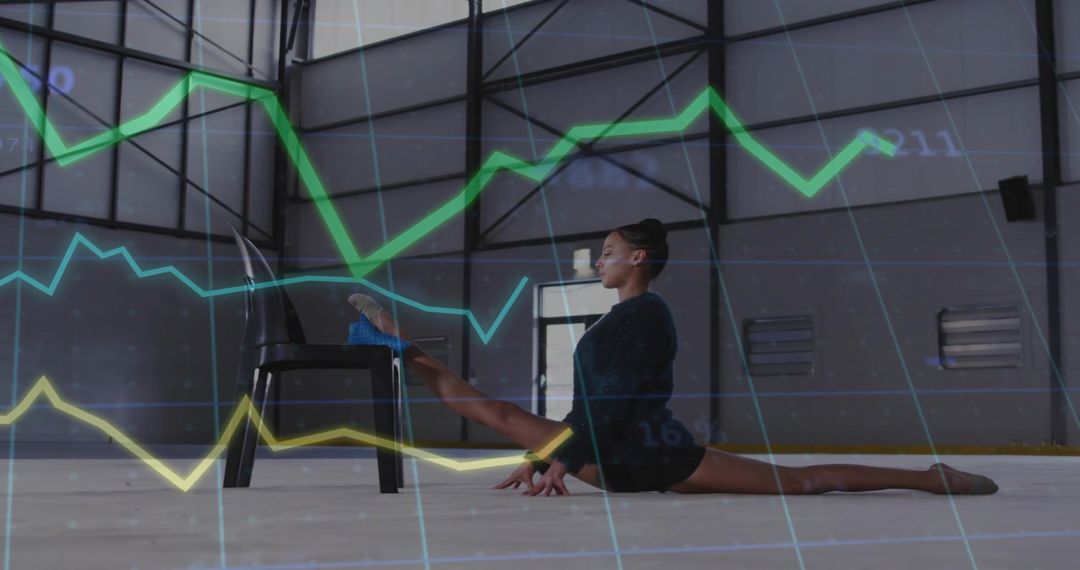
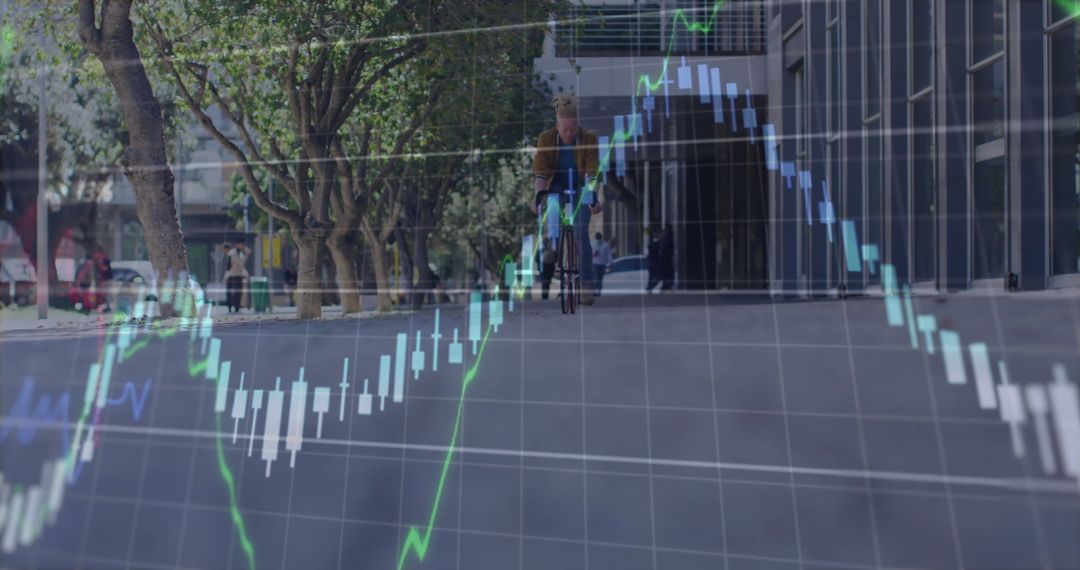
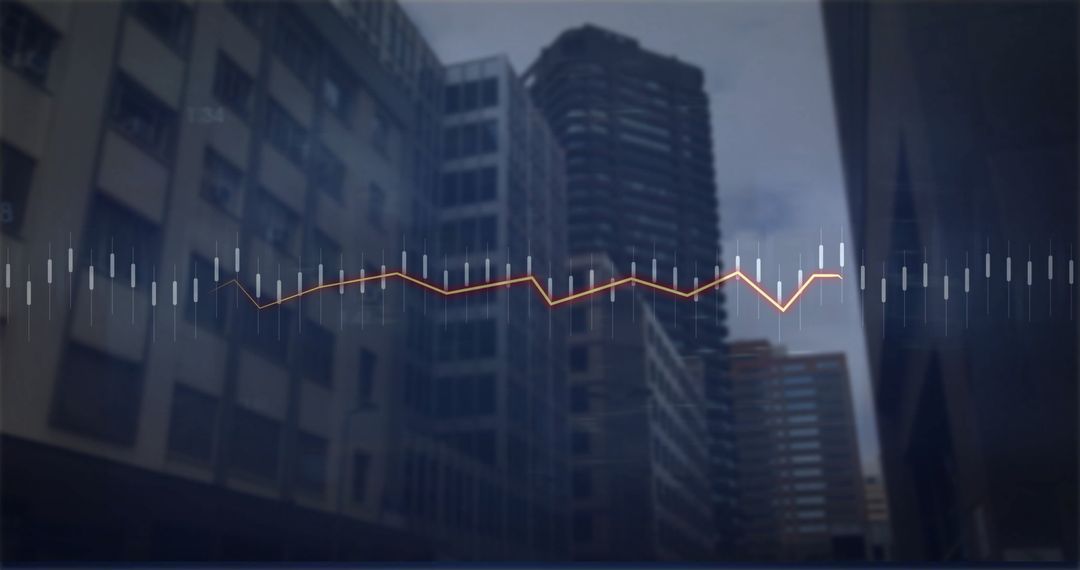
- Abstract Blend of Statistical Graphs with Urban Scene
Abstract Blend of Statistical Graphs with Urban Scene Image

The image depicts a blend of statistical data processing with a bustling urban office environment. Illustrated with dynamic motion, representing the fast-paced intersection of technology and corporate life. Useful for presentations and designs focusing on data-driven decision-making, digital transformations, or modern business growth.
Powered by 


6
downloads
downloads
Tags:
More
Credit Photo
If you would like to credit the Photo, here are some ways you can do so
Text Link
photo Link
<span class="text-link">
<span>
<a target="_blank" href=https://pikwizard.com/photo/abstract-blend-of-statistical-graphs-with-urban-scene/51200ebde6ff22d5f3a907165ac65d22/>PikWizard</a>
</span>
</span>
<span class="image-link">
<span
style="margin: 0 0 20px 0; display: inline-block; vertical-align: middle; width: 100%;"
>
<a
target="_blank"
href="https://pikwizard.com/photo/abstract-blend-of-statistical-graphs-with-urban-scene/51200ebde6ff22d5f3a907165ac65d22/"
style="text-decoration: none; font-size: 10px; margin: 0;"
>
<img src="https://pikwizard.com/pw/medium/51200ebde6ff22d5f3a907165ac65d22.jpg" style="margin: 0; width: 100%;" alt="" />
<p style="font-size: 12px; margin: 0;">PikWizard</p>
</a>
</span>
</span>
Free (free of charge)
Free for personal and commercial use.
Author: Awesome Content
Similar Free Stock Images

Premium


Premium


Premium


Premium


Premium


Premium


Premium


Premium


Premium


Premium


Premium


Premium


Premium


Premium


Premium


Premium


Premium


Premium


Premium


Premium


Premium


Premium


Premium


Premium