
- Home >
- Stock Photos >
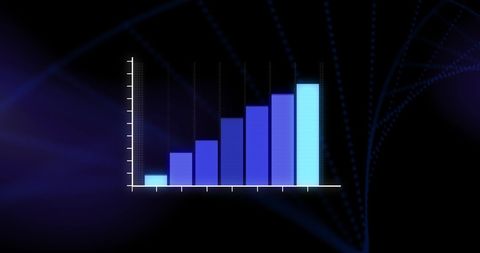
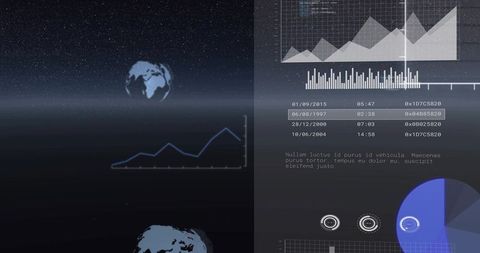
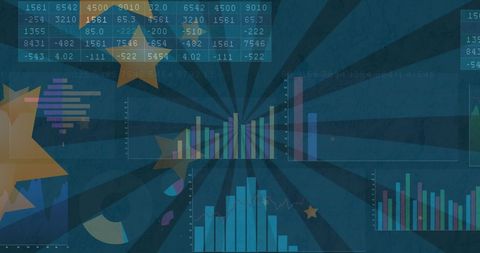
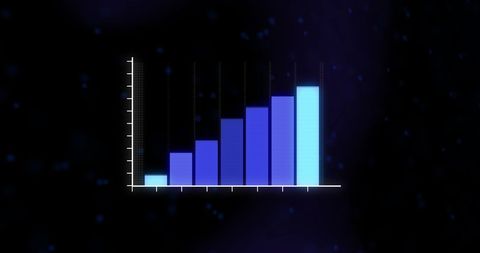
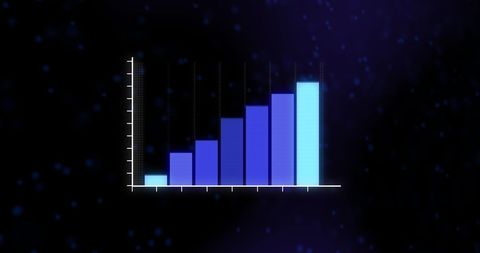
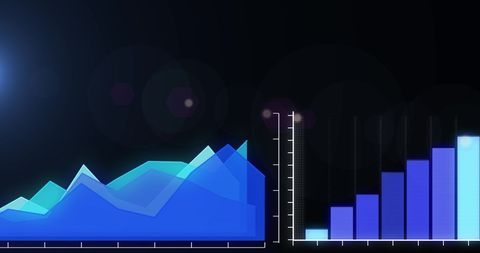
- Abstract Blue Data Charts on Dark Gray Background
Abstract Blue Data Charts on Dark Gray Background Image
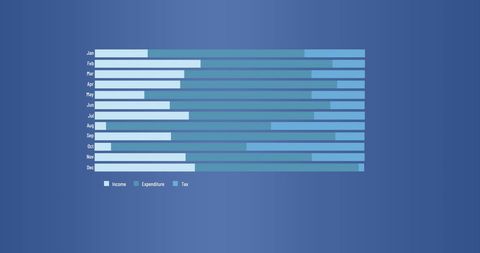
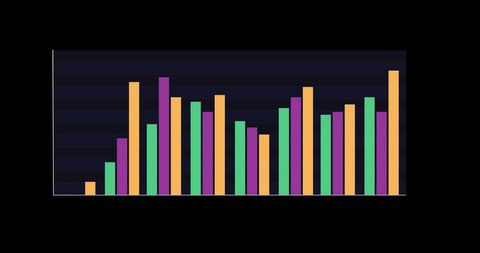
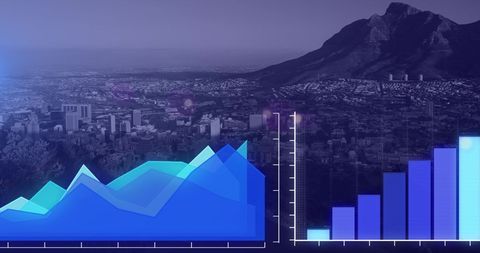
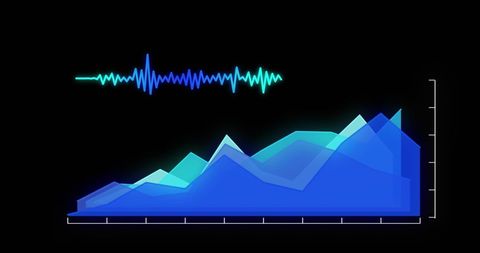
This abstract graphical illustration showcases data charts and graphs with a futuristic glow on a dark gray background. The image displays a mingling of line and bar graphs, illustrating data trends and business analytics with a modern aesthetic. Suitable for use in presentations, articles, and reports to emphasize concepts in digital technology, data processing, business analysis, and global networks.
Powered by  - Get 15% off with code: PIKWIZARD15


downloads
Tags:
More
Credit Photo
If you would like to credit the Photo, here are some ways you can do so
Text Link
photo Link
<span class="text-link">
<span>
<a target="_blank" href=https://pikwizard.com/photo/abstract-blue-data-charts-on-dark-gray-background/f3eec8df0abfe07f9cbe916ce8e5bd62/>PikWizard</a>
</span>
</span>
<span class="image-link">
<span
style="margin: 0 0 20px 0; display: inline-block; vertical-align: middle; width: 100%;"
>
<a
target="_blank"
href="https://pikwizard.com/photo/abstract-blue-data-charts-on-dark-gray-background/f3eec8df0abfe07f9cbe916ce8e5bd62/"
style="text-decoration: none; font-size: 10px; margin: 0;"
>
<img src="https://pikwizard.com/pw/medium/f3eec8df0abfe07f9cbe916ce8e5bd62.jpg" style="margin: 0; width: 100%;" alt="" />
<p style="font-size: 12px; margin: 0;">PikWizard</p>
</a>
</span>
</span>
Free (free of charge)
Free for personal and commercial use.
Author: Awesome Content
Similar Free Stock Images

Premium


Premium


Premium


Premium

Premium

Premium


Premium


Premium

Premium

Premium


Premium


Premium


Premium


Premium


Premium


Premium

Premium


Premium


Premium

Premium


Premium


Premium


Premium


Premium


Premium


Explore More Free Stock Images