- Home >
- Stock Photos >
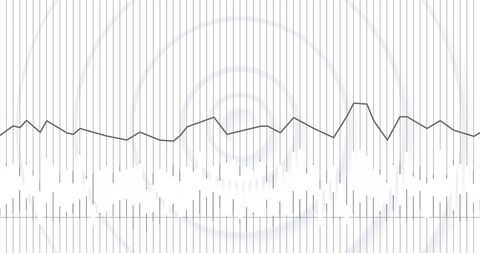
- Abstract Blue Data Visualization with Line Graph and Digital Interface Elements
Abstract Blue Data Visualization with Line Graph and Digital Interface Elements Image

This abstract illustration shows a blue digital landscape featuring swirling shapes overlaid with a dynamic line graph and various data interface elements, representing digital technology and data analysis themes. Ideal for use in presentations, digital wallpapers, and websites related to technology, finance, data analytics, and futuristic design.

downloads
Tags:
More
Credit Photo
If you would like to credit the Photo, here are some ways you can do so
Text Link
photo Link
<span class="text-link">
<span>
<a target="_blank" href=https://pikwizard.com/photo/abstract-blue-data-visualization-with-line-graph-and-digital-interface-elements/60dfc6a75602a8e401fe4440b55bfa3f/>PikWizard</a>
</span>
</span>
<span class="image-link">
<span
style="margin: 0 0 20px 0; display: inline-block; vertical-align: middle; width: 100%;"
>
<a
target="_blank"
href="https://pikwizard.com/photo/abstract-blue-data-visualization-with-line-graph-and-digital-interface-elements/60dfc6a75602a8e401fe4440b55bfa3f/"
style="text-decoration: none; font-size: 10px; margin: 0;"
>
<img src="https://pikwizard.com/pw/medium/60dfc6a75602a8e401fe4440b55bfa3f.jpg" style="margin: 0; width: 100%;" alt="" />
<p style="font-size: 12px; margin: 0;">PikWizard</p>
</a>
</span>
</span>
Free (free of charge)
Free for personal and commercial use.
Author: Authentic Images