
- Home >
- Stock Photos >
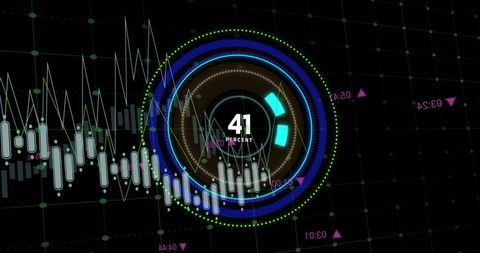
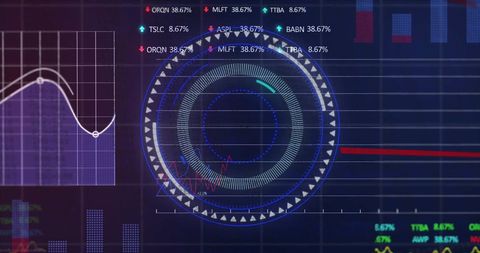
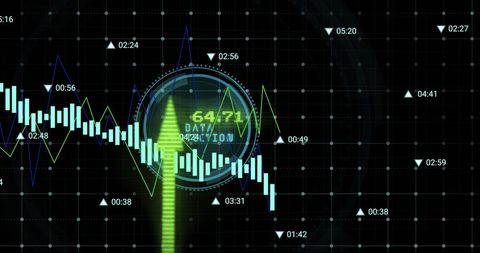
- Abstract Business Analytics with Diverse Data Graphs and Scanner Interface
Abstract Business Analytics with Diverse Data Graphs and Scanner Interface Image

Abstract representation of business analytics with various colorful data graphs overlaid on a circular scanner interface against a blue backdrop. Ideal for marketing materials and presentations on data analysis, digital marketing, business growth strategies, and technological advancements in analytics. Useful for representing topics on finance, IT solutions, and digital transformations.
Powered by 


downloads
Tags:
More
Credit Photo
If you would like to credit the Photo, here are some ways you can do so
Text Link
photo Link
<span class="text-link">
<span>
<a target="_blank" href=https://pikwizard.com/photo/abstract-business-analytics-with-diverse-data-graphs-and-scanner-interface/6c2d135d2d5e2364746a02413273f334/>PikWizard</a>
</span>
</span>
<span class="image-link">
<span
style="margin: 0 0 20px 0; display: inline-block; vertical-align: middle; width: 100%;"
>
<a
target="_blank"
href="https://pikwizard.com/photo/abstract-business-analytics-with-diverse-data-graphs-and-scanner-interface/6c2d135d2d5e2364746a02413273f334/"
style="text-decoration: none; font-size: 10px; margin: 0;"
>
<img src="https://pikwizard.com/pw/medium/6c2d135d2d5e2364746a02413273f334.jpg" style="margin: 0; width: 100%;" alt="" />
<p style="font-size: 12px; margin: 0;">PikWizard</p>
</a>
</span>
</span>
Free (free of charge)
Free for personal and commercial use.
Author: People Creations
Similar Free Stock Images

Premium


Premium


Premium


Premium


Premium


Premium

Premium


Premium


Premium


Premium


Premium


Premium


Premium

Premium


Premium


Premium

Premium


Premium


Premium


Premium


Premium


Premium


Premium


Premium


Premium
Explore More Free Stock Images