- Home >
- Stock Photos >
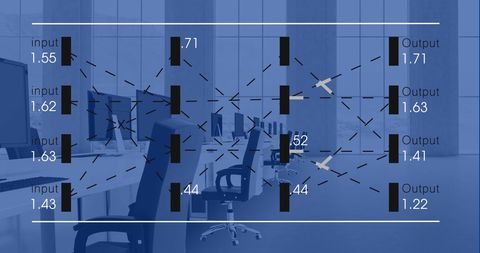
- Abstract Business Data Visualization in Office
Abstract Business Data Visualization in Office Image

Abstract representation of a digital interface merging with office background to showcase business data technology. Suitable for conveying a sense of futuristic financial analysis and business intelligence in corporate presentations, tech blogs, or innovation articles.

downloads
Tags:
More
Credit Photo
If you would like to credit the Photo, here are some ways you can do so
Text Link
photo Link
<span class="text-link">
<span>
<a target="_blank" href=https://pikwizard.com/photo/abstract-business-data-visualization-in-office/2245194b63207bef4a3b4ac4b62d9f5b/>PikWizard</a>
</span>
</span>
<span class="image-link">
<span
style="margin: 0 0 20px 0; display: inline-block; vertical-align: middle; width: 100%;"
>
<a
target="_blank"
href="https://pikwizard.com/photo/abstract-business-data-visualization-in-office/2245194b63207bef4a3b4ac4b62d9f5b/"
style="text-decoration: none; font-size: 10px; margin: 0;"
>
<img src="https://pikwizard.com/pw/medium/2245194b63207bef4a3b4ac4b62d9f5b.jpg" style="margin: 0; width: 100%;" alt="" />
<p style="font-size: 12px; margin: 0;">PikWizard</p>
</a>
</span>
</span>
Free (free of charge)
Free for personal and commercial use.
Author: Awesome Content