
- Home >
- Stock Photos >
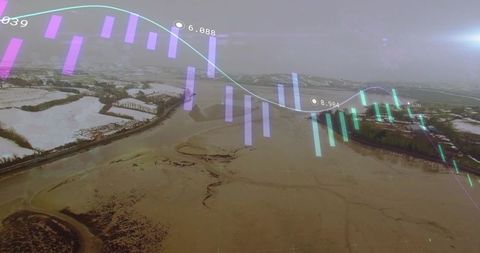
- Abstract Business Data Visualization in Rainy Skyline
Abstract Business Data Visualization in Rainy Skyline Image

Abstract depiction of business data visualization overlaying a tall building in the rain. Useful for technology and finance industry themes, digital transformation concepts, and urban analytics projects.
Powered by  - Get 15% off with code: PIKWIZARD15


downloads
Tags:
More
Credit Photo
If you would like to credit the Photo, here are some ways you can do so
Text Link
photo Link
<span class="text-link">
<span>
<a target="_blank" href=https://pikwizard.com/photo/abstract-business-data-visualization-in-rainy-skyline/babc4da14a9c4d82fac0da1e8f2dc7b7/>PikWizard</a>
</span>
</span>
<span class="image-link">
<span
style="margin: 0 0 20px 0; display: inline-block; vertical-align: middle; width: 100%;"
>
<a
target="_blank"
href="https://pikwizard.com/photo/abstract-business-data-visualization-in-rainy-skyline/babc4da14a9c4d82fac0da1e8f2dc7b7/"
style="text-decoration: none; font-size: 10px; margin: 0;"
>
<img src="https://pikwizard.com/pw/medium/babc4da14a9c4d82fac0da1e8f2dc7b7.jpg" style="margin: 0; width: 100%;" alt="" />
<p style="font-size: 12px; margin: 0;">PikWizard</p>
</a>
</span>
</span>
Free (free of charge)
Free for personal and commercial use.
Author: Awesome Content
Similar Free Stock Images

Premium


Premium


Premium


Premium


Premium


Premium


Premium


Premium


Premium


Premium


Premium


Premium


Premium


Premium


Premium

Premium


Premium


Premium


Premium


Premium


Premium


Premium


Premium


Premium


Premium

Explore More Free Stock Images