1. Home > 
  2. Stock Photos > 
  3. Abstract Business Infographic Overlay on Blurred City Traffic

Abstract Business Infographic Overlay on Blurred City Traffic Image

Abstract Business Infographic Overlay on Blurred City Traffic

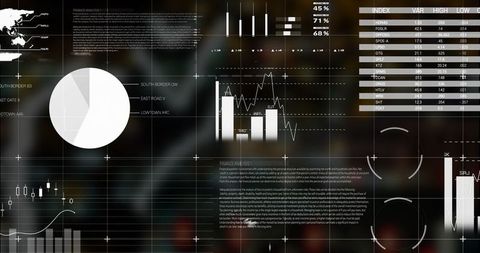
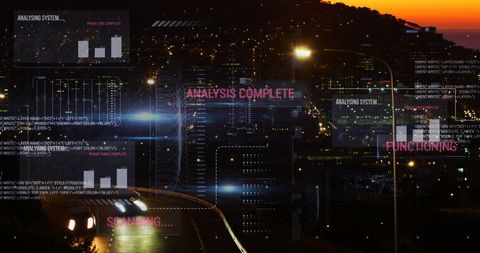
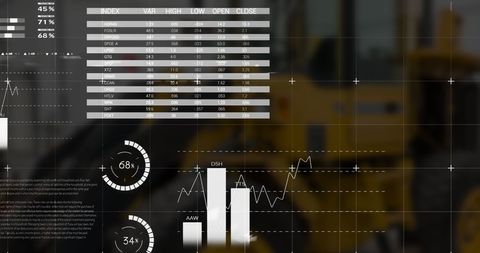
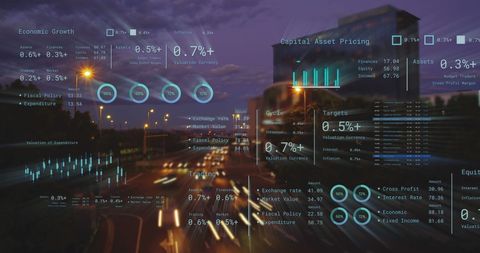
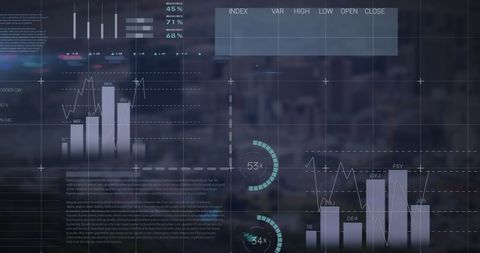
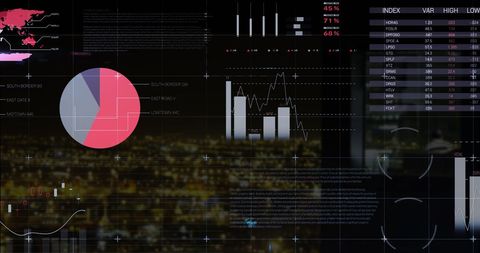
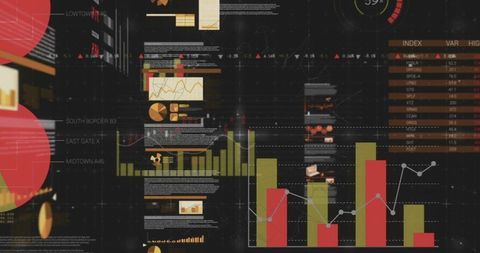
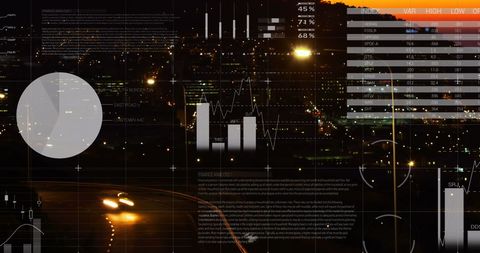
This illustration displays a digital interface of business infographics overlaid on blurred city traffic at night, emphasizing futuristic and data-driven themes. Ideal for presentations and covers related to urban planning, technological solutions, or financial analytics, this graphic combines efficiency and modernity with an abstract flair.

Powered by Shutterstock logo - Get 15% off with code: PIKWIZARD15
Blue and green abstract presentation slide templates. Infographic elements template  set for web annual report brochure, business flyer leaflet marketing and advertising template. Vector Illustration - Powered by Shutterstock - Get 15% off with code: PIKWIZARD15Futuristic Digital Growth Chart – 3D Bar Graph with Glowing Blue Data Visualization - Powered by Shutterstock - Get 15% off with code: PIKWIZARD15Businessman using pen touch candle chart financial growth of business and world economy. Stock market price increase. Stock market investment analysis, financial risk management and investment. - Powered by Shutterstock - Get 15% off with code: PIKWIZARD15Forex market growth and business investing concept with man finger on digital touch screen with trading diagram and graphs on dark background - Powered by Shutterstock - Get 15% off with code: PIKWIZARD15Hand holding smartphone displays data visualizations, including histogram and pie chart. Analytics, digital transformation and increasing use of mobile technology in business. Minimalist art collage. - Powered by Shutterstock - Get 15% off with code: PIKWIZARD15

Credit Photo

If you would like to credit the Photo, here are some ways you can do so

Free (free of charge)

Free for personal and commercial use.

Author: People Creations

Similar Free Stock Images

Loading...
Mathematical Equations Overlaying Financial Data Visualization
Premium
Professional analyzing financial data graphs, charts on laptop display at a modern workspace. Financial analysis or business evaluation concept
Digital Financial Data Interface Over Cityscape Conceptual Background
Premium
AI-Driven Workflow, Automating Data Management Analytics and Business Reports with KPIs, Predictive Insights, and Big Data Integration. Businessman touching Virtual Screen with Decision-Making Tech.
Digital Analytics Interface Overlaying Night City Traffic
Digital Interface with Stock Market Graphs and Statistics
Digital Financial Data Display with Graphs and Analytics
Premium
Business 2025 analytics tools charts and graphs with statistics to analyze business potential and forecast future development of companies growth. Businessman using a tablet.
Futuristic Data Analytics Dashboard with Holographic Interface
Premium
Businessman using KPI dashboard.Financial business KPI System data analytics graph dashboard.Data System KPI and metrics connected in database for follow earnings,operations and sales data.
Futuristic Financial Data Visualization
Futuristic Digital Dashboard with Business Analytics
Digital Interface with Data Visualization and Analytics Elements
Holographic Financial Infographic with Global Report Interface
Abstract Bokeh with Futuristic Infographic Interface Overlay
Infographic Interface Over Cityscape: Business Growth Analysis
Futuristic Infographic Interface Over Cityscape
Futuristic Digital Interface Overlaying Cityscape
Premium
Businessperson analyzing net zero carbon dashboard hologram, showing CO2 emission data and sustainable energy icons, highlighting carbon reduction and environmental responsibility concept.
Dynamic Financial Data Analysis on Blue Digital Interface
Digital Interface Showing Data Analytics with Graphs and Charts
Analyzing Digital Graphs Highlighting Financial Data Trends
Financial Data Processing Visualization on Dark Background
Premium
A person is holding a tablet with a marketing funnel on it. The funnel is made up of different colored bowls, each representing a different stage of the funnel
Abstract Financial Data Interface Enhancing Modern Cityscape
Digital Financial Data Interface on Dark Background
Dynamic Graphs and Financial Statistics in Digital Interface
Futuristic Data Analysis Concepts with Neon Graphs
Premium
KPI key performance indicator business technology concept. Business executives use business news metrics to measure success against planned targets, Improving business process efficiency.
Digital Interface with Floating Data Panels and Charts Visualization
Eco-Financial Metrics Dashboard with Sustainability and Technology Focus
Digital Financial Data Dashboard with Bar and Line Graphs
Futuristic Data and Statistics Interface in Modern Server Room
Financial Data Displayed Over Cityscape in Digital Interface
Digital Data Processing and Global Networking Visualization
Data Processing and Analysis with Mathematical Equations
High-Tech Data Interface Over Cityscape Traffic at Night
Premium
Scientist working with business data, finance, marketing report, Big Data Analytics technology, Processing Complexity information flow on virtual screen, machine learning, artificial intelligence, ML
Digital Financial Data Visualization Over Payment Terminal Interface
Premium
Business finance data analytics graph.Financial management technology.Advisor using KPI Dashboard on virtual screen.
Dynamic Digital Interface with Stock Market Analysis
Digital Financial Data Analysis with Graphs and Charts
Financial Data Visualization Over Cityscape with Digital Graphs
Futuristic AI Chat Interface with Data Diagrams
Premium
Financial report with pie chart and data on a laptop with business woman's hands at work
Premium
e-Business Technology Conference Presentation: Expressive, Female, Black Tech Engineer Pitching Revolutionary Innovative Product. Whiteboard Shows Graphs, Infographics, AI, Big Data, Mindmapping
Business Infographic Interface Over Modern Cityscape at Sunset
Social Media Integration in Cityscape with Digital Analytics
Digital Data Processing Interface with Technology Elements
Stock Market Analysis Digital Screen with Graphs and Trends
Premium
Businessman points a graph depicting the growth of business, data analysis in shaping a thriving global enterprise of blockchain technology and strategic planning in the modern business
Premium
Male coach hold seminar for staff, makes presentation, provides sales statistics explanation gathered in modern conference room, with monitor screen with infographic charts, graphs and diagrams data
Premium
Big data analysis with AI technology for business analytics. Insights from data mining, filtering, sorting, clustering. Data scientist working on machine learning on virtual computer screen.
Futuristic Financial Data Analysis Interface Concept
Financial Data Processing with Charts and Graphics on Digital Blue Background
Financial Data Processing Interface on Black Background
Dynamic Changing Data Visualization in Digital Dashboard
Digital Interface with Global Financial Data and Graphs
Futuristic Digital Analytics Interface with Visual Data Charts
Futuristic Cyber Dashboard with Binary Streams and Global Maps
Futuristic Cyber Code Interface Over Cityscape Booming
Premium
Presentation in Multi-Ethnic Office Conference Room. Meeting of Diverse Young Entrepreneurs, Specialists, Talking, Using TV for infographics. Businesspeople Develop e-Commerce Startup.
Global Financial Data Analysis Over High-Speed Cityscape
Data Analysis With Cityscape and Digital Charts
Premium
Business 2025 graphs statistics to analyze business potential concepts, Businesswomen use Laptop analytics charts, forecast the future, Marketing targets growth to optimize performance for profit.
Digital Data Visualization Over Urban Skyline Concept
Premium
Big data technology and data science. Data scientist querying, analysing and visualizing complex set on virtual screen. Data flow concept. Neural network, artificial intelligence, ML, analytics.
Digital Financial Market Data Analyzing on Modern Screen
Abstract Data Processing for Global Stock Market Analysis
Abstract Chart and Graphs Illustrating Digital Data Analysis
Abstract Digital Dashboard with Financial Data Visuals
Futuristic Data Analysis Interface with Graphs and Charts
Digital Data Interface with Analytics Displayed on Futuristic Screen
Digital Interface Displaying Financial and Data Charts in Blue Tones
Premium
Modern presentation slide templates. Infographic elements template  set for web, print, annual report brochure, business flyer leaflet marketing and advertising template. Vector Illustration
Digital Data Analytics Overlay with City Background
Futuristic Data Processing with Digital Displays
Digital Interface Displaying Global Finance Data Charts
Premium
Man look at the dashboard with graphs and charts. Concept of data management system, business intelligence, data statistics, marketing analysis, key performance indicators (KPI) and analytics.
Premium
Online trading, Investment, Strategy market plan, and Stock mark
Digital Interface Visualizing Data Metrics and Analytics
Data Analysis and Technology Screens with Mathematical Equations
Futuristic Data Processing User Interface Background
Digital Interface with Financial Data Analytics Charts
Financial Analytics Display with Digital Graphs and Charts
Financial Data Analytics on Digital Interface
Digital Global Analytics Interface with Infographics and Data Visualization
Premium
Businessman using futuristic user interface with virtual data analytics. Innovative dashboard with financial charts, graphs, and global network information for business intelligence.
Financial Data and Analytics Display Over Cityscape Background
Complex Digital Dashboard Interface Displaying Financial Data and Growth Analytics
Digital Data Processing and Analytics in Modern Business Innovation
Futuristic Computer Screen with Digital Data and Analytics
Premium
Python Programming Web Development Coding Concept.Software development concepts and programming for various devices, Software Engineer Computer programming, coding process, chart, and Data analytics.
Neon HTML Code Snippet with Syntax Highlighting and Cybersecurity Tags on Dark Gradient
Dynamic Digital Data Visualization with Graphs and Statistics
Financial Data Analysis Over Cityscape at Sunset
Cybernetic Financial Analysis Overlay on Cityscape
Digital Data Processing Dashboard in Global Connection Visualization
Data Analysis Dashboard Overlaid on Night City Traffic Background
Digital Data Analysis with Futuristic Charts
Data and Analytics Overlay on Bustling Cityscape
Digital Interface Displaying Stock Market Data and Statistics
Digital Interface Displaying Live Data and Networking Concepts
Futuristic Digital Interface Displaying Data and Graphs
Global Digital Interface Visualizing Data Processing
Premium
Business people using website or AI software technology analyze data and big data technology. business analysis and display images of complex data sets on a computer on the screen. artificial
Financial Data Analytics over Urban Cityscape
Digital Hologram Display with Analysis and Data Visuals
Statistical Data Overlay on Nighttime Cityscape Traffic Scene
Abstract Financial Data Processing Interface
Infographic Interface Overlay on Aerial Cityscape Conveys Business Growth
Digital Finance Analytics in Modern Business Environment
Digital Financial Data Visualization with Dynamic Graphs
Global Data Analytics and Network Visualization on Digital Grid
Futuristic Data Visualization with Graphs and Charts
Digital Financial Analysis with Mathematical Equations
Futuristic Interface with Digital Code and Visual Analytics
Digital Financial Data Analysis on Futuristic Blue Interface
Futuristic Cityscape with Scanning Analysis Interface at Sunset
Digital Data Processing with Text Overlay on Grid Background
Premium
Conference Business Meeting Presentation: CEO Businessman Shows Data to Group of Investors, Businessspeople. Projector Screen Shows Graphs, Product Sales, Revenue Growth Strategy, e-Commerce Analysis
Premium
Conference Business Meeting Presentation: CEO Businessman Shows Data to Group of Investors, Businessspeople. Projector Screen Shows Graphs, Product Sales, Revenue Growth Strategy, e-Commerce Analysis
Futuristic Financial Dashboard with City Skyline Background
Innovative Data Visualization Dashboard with Interactive UI
Data Analytics Dashboard with Charts, World Map, and Metrics