
- Home >
- Stock Photos >
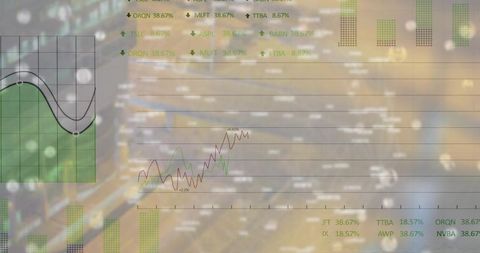
- Abstract Business Technology Data Presentation
Abstract Business Technology Data Presentation Image

Illustrates digital data representation ideal for business presentations or economic reports. Useful in explaining trends, financial forecasting, or promoting technology solutions for data analysis. Graphic overlay suggests modernity and progress in digital technologies.
Powered by 


downloads
Tags:
More
Credit Photo
If you would like to credit the Photo, here are some ways you can do so
Text Link
photo Link
<span class="text-link">
<span>
<a target="_blank" href=https://pikwizard.com/photo/abstract-business-technology-data-presentation/dd3d412e48b2a9160fe3f8ddd9a4ff25/>PikWizard</a>
</span>
</span>
<span class="image-link">
<span
style="margin: 0 0 20px 0; display: inline-block; vertical-align: middle; width: 100%;"
>
<a
target="_blank"
href="https://pikwizard.com/photo/abstract-business-technology-data-presentation/dd3d412e48b2a9160fe3f8ddd9a4ff25/"
style="text-decoration: none; font-size: 10px; margin: 0;"
>
<img src="https://pikwizard.com/pw/medium/dd3d412e48b2a9160fe3f8ddd9a4ff25.jpg" style="margin: 0; width: 100%;" alt="" />
<p style="font-size: 12px; margin: 0;">PikWizard</p>
</a>
</span>
</span>
Free (free of charge)
Free for personal and commercial use.
Author: Awesome Content
Similar Free Stock Images

Premium


Premium

Premium


Premium


Premium


Premium


Premium


Premium


Premium

Premium

Premium


Premium

Premium

Premium


Premium


Premium


Premium


Premium


Premium


Premium


Premium


Premium


Premium


Premium


Premium

Explore More Free Stock Images