- Home >
- Stock Photos >
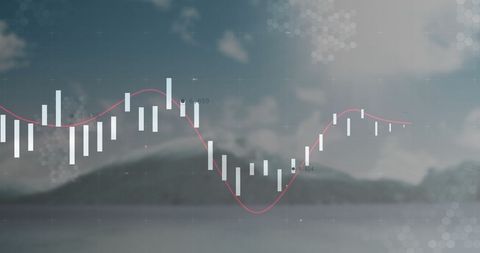
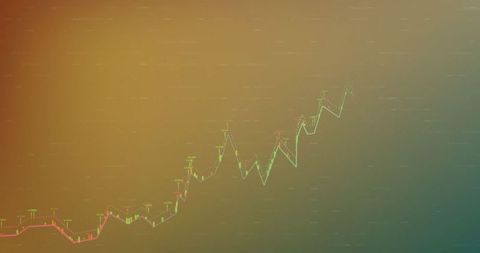
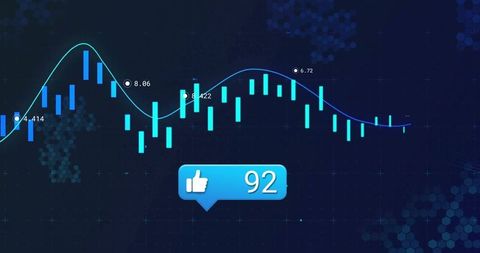
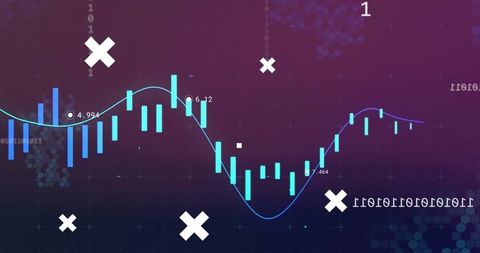
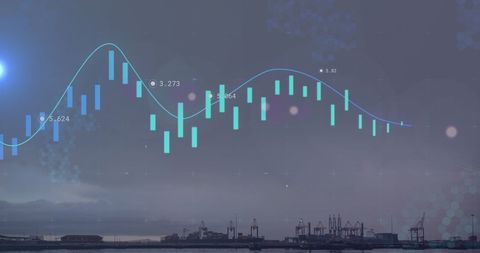
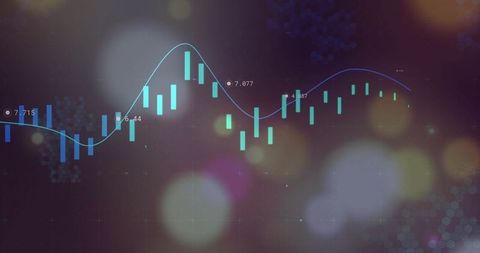
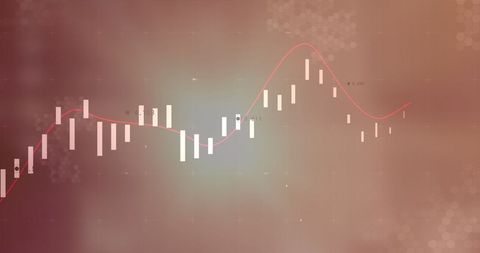
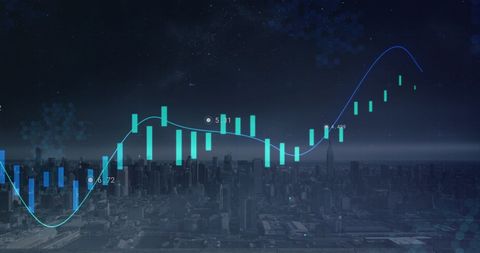
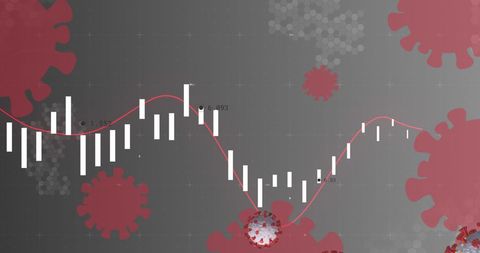
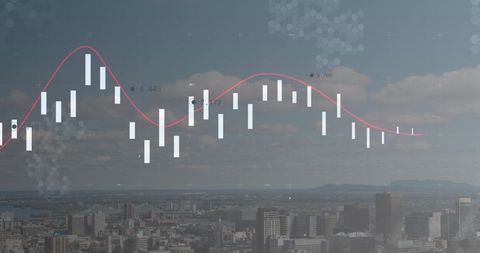
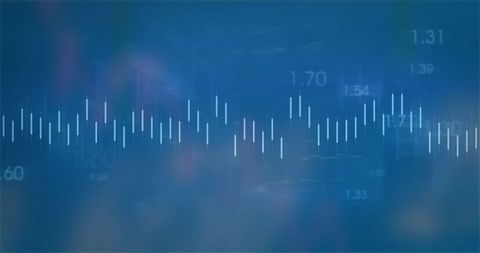
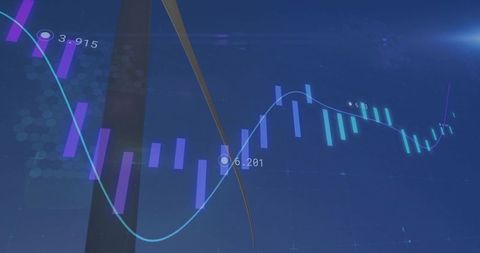
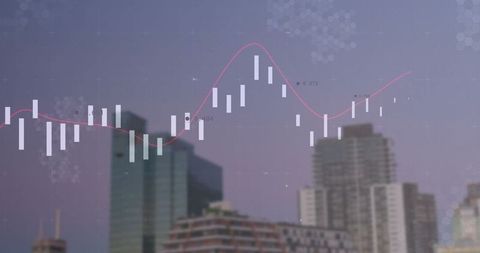
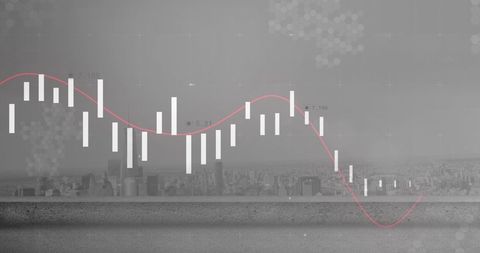
- Abstract Candlestick Chart on Gradient Background
Abstract Candlestick Chart on Gradient Background Image
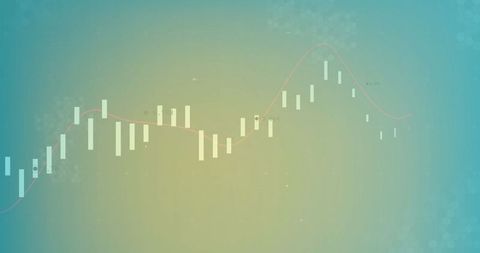
Candlestick chart on a blue green gradient highlighting the pattern of stock values over an undetermined period. The visual interface combines white bars, red price movement indicators, and markings to summarize changes, popular for financial discourse and insights in analytic segments. Useful for digital content on investing sessions, presentations about key trends, dilemmas entrepreneurs wrestle with, or to visually address devote finance-savvy individuals taking action for what’s ahead.
Powered by  - Get 15% off with code: PIKWIZARD15


downloads
Tags:
More
Credit Photo
If you would like to credit the Photo, here are some ways you can do so
Text Link
photo Link
<span class="text-link">
<span>
<a target="_blank" href=https://pikwizard.com/photo/abstract-candlestick-chart-on-gradient-background/033ff70934b7164cd9942a1acfbb9681/>PikWizard</a>
</span>
</span>
<span class="image-link">
<span
style="margin: 0 0 20px 0; display: inline-block; vertical-align: middle; width: 100%;"
>
<a
target="_blank"
href="https://pikwizard.com/photo/abstract-candlestick-chart-on-gradient-background/033ff70934b7164cd9942a1acfbb9681/"
style="text-decoration: none; font-size: 10px; margin: 0;"
>
<img src="https://pikwizard.com/pw/medium/033ff70934b7164cd9942a1acfbb9681.jpg" style="margin: 0; width: 100%;" alt="" />
<p style="font-size: 12px; margin: 0;">PikWizard</p>
</a>
</span>
</span>
Free (free of charge)
Free for personal and commercial use.
Author: People Creations