- Home >
- Stock Photos >
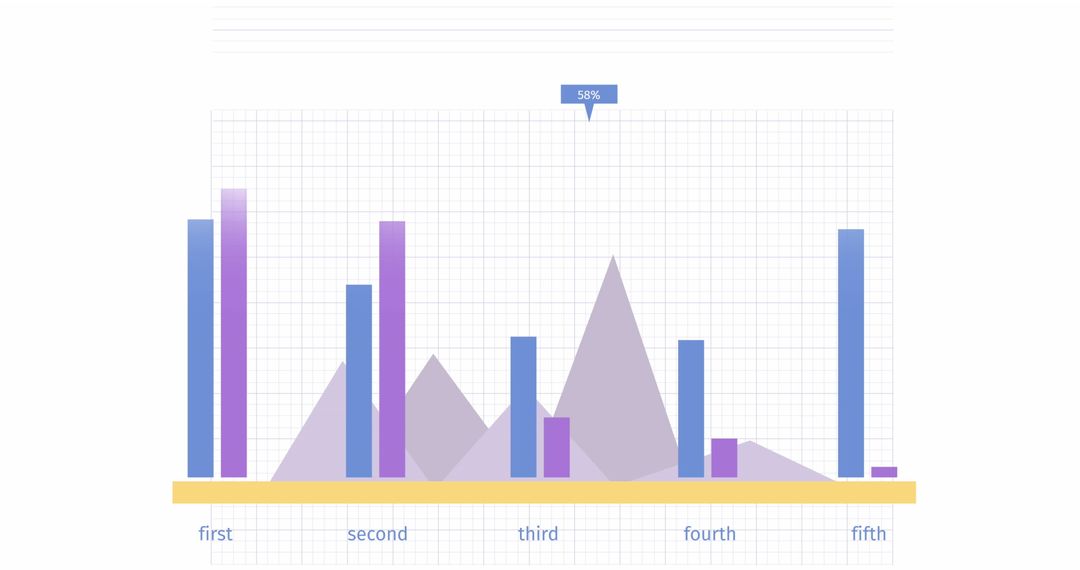
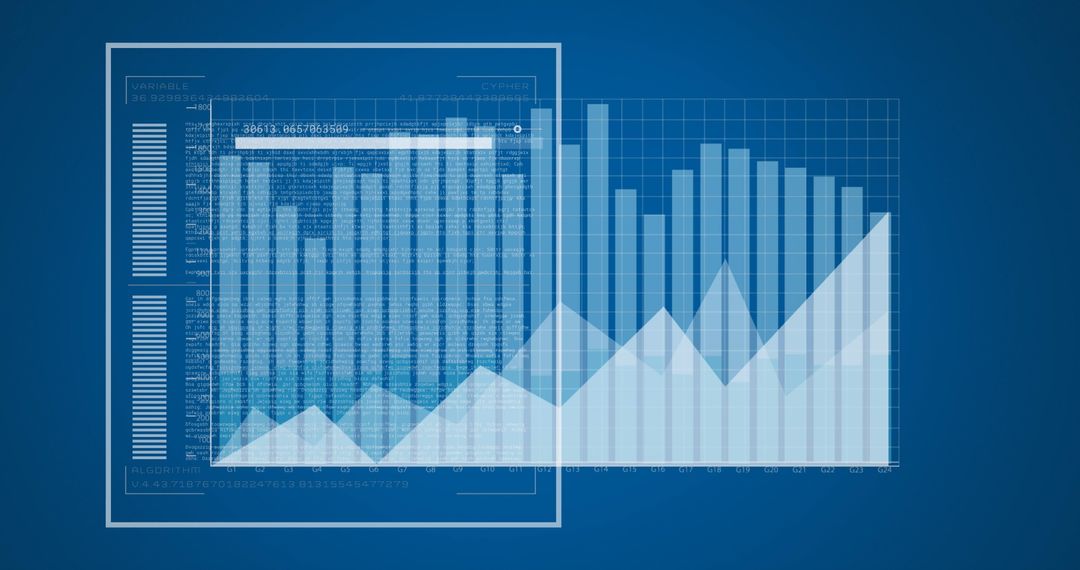
- Abstract Chart with Multicolor Accents Representing Business Analytics
Abstract Chart with Multicolor Accents Representing Business Analytics Image

This vibrant representation combines digital graphs with colorful accents to illustrate business analytics concepts. Ideal for presentations on data analysis, finance, technological processes, or progress updates, it serves as a visually captivating aid for subjects involving complex information. Great for webinars, reports, and educational materials focusing on data-driven strategy and innovations in business technology.
Powered by 


2
downloads
downloads
Tags:
More
Credit Photo
If you would like to credit the Photo, here are some ways you can do so
Text Link
photo Link
<span class="text-link">
<span>
<a target="_blank" href=https://pikwizard.com/photo/abstract-chart-with-multicolor-accents-representing-business-analytics/8fe101dc06bee17a6ca018f245c0813c/>PikWizard</a>
</span>
</span>
<span class="image-link">
<span
style="margin: 0 0 20px 0; display: inline-block; vertical-align: middle; width: 100%;"
>
<a
target="_blank"
href="https://pikwizard.com/photo/abstract-chart-with-multicolor-accents-representing-business-analytics/8fe101dc06bee17a6ca018f245c0813c/"
style="text-decoration: none; font-size: 10px; margin: 0;"
>
<img src="https://pikwizard.com/pw/medium/8fe101dc06bee17a6ca018f245c0813c.jpg" style="margin: 0; width: 100%;" alt="" />
<p style="font-size: 12px; margin: 0;">PikWizard</p>
</a>
</span>
</span>
Free (free of charge)
Free for personal and commercial use.
Author: People Creations
Similar Free Stock Images

Premium


Premium


Premium


Premium


Premium


Premium


Premium


Premium


Premium


Premium


Premium


Premium


Premium


Premium


Premium


Premium


Premium


Premium


Premium


Premium


Premium


Premium


Premium


Premium