
- Home >
- Stock Photos >
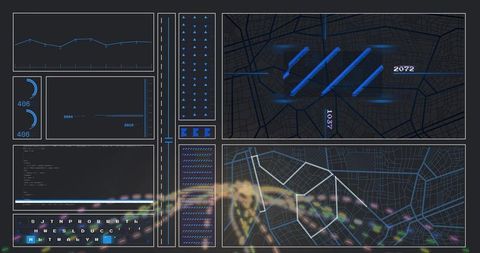
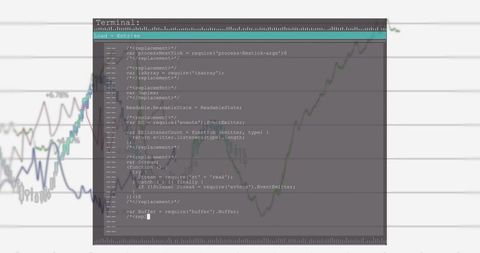
- Abstract City Skyline with Data Graph and Code
Abstract City Skyline with Data Graph and Code Image

Visualization displays a white line graph overlay on a black city skyline against green grid with code fragments. Perfect for illustrating concepts related to technology, cybersecurity analytics, and data-driven urbanization. Useful in tech websites, business presentations, and data science blogs focusing on innovation and tech solutions.
Powered by 


downloads
Tags:
More
Credit Photo
If you would like to credit the Photo, here are some ways you can do so
Text Link
photo Link
<span class="text-link">
<span>
<a target="_blank" href=https://pikwizard.com/photo/abstract-city-skyline-with-data-graph-and-code/c20de78132ee29103f38120cf00d7e09/>PikWizard</a>
</span>
</span>
<span class="image-link">
<span
style="margin: 0 0 20px 0; display: inline-block; vertical-align: middle; width: 100%;"
>
<a
target="_blank"
href="https://pikwizard.com/photo/abstract-city-skyline-with-data-graph-and-code/c20de78132ee29103f38120cf00d7e09/"
style="text-decoration: none; font-size: 10px; margin: 0;"
>
<img src="https://pikwizard.com/pw/medium/c20de78132ee29103f38120cf00d7e09.jpg" style="margin: 0; width: 100%;" alt="" />
<p style="font-size: 12px; margin: 0;">PikWizard</p>
</a>
</span>
</span>
Free (free of charge)
Free for personal and commercial use.
Author: Creative Art
Similar Free Stock Images

Premium


Premium


Premium


Premium

Premium

Premium


Premium

Premium

Premium


Premium


Premium

Premium


Premium


Premium


Premium


Premium


Premium


Premium


Premium


Premium


Premium


Premium


Premium


Premium


Premium

Explore More Free Stock Images