- Home >
- Stock Photos >
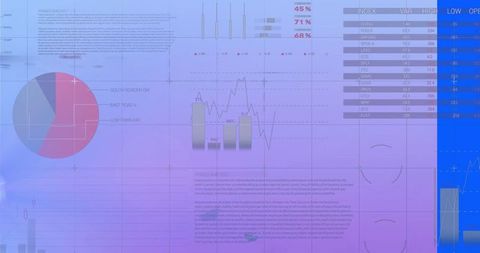
- Abstract Dashboard Interface Displaying Data Visualization
Abstract Dashboard Interface Displaying Data Visualization Image

Abstract dashboard showing data visualizations with pie chart, bar and line graphs, creating a high-tech aesthetic. Ideal for illustrating technology concepts in digital analytics or presenting online financial data. Useful for backgrounds in finance, technology presentations, and education materials focusing on data interpretation and reporting.

downloads
Tags:
More
Credit Photo
If you would like to credit the Photo, here are some ways you can do so
Text Link
photo Link
<span class="text-link">
<span>
<a target="_blank" href=https://pikwizard.com/photo/abstract-dashboard-interface-displaying-data-visualization/bccc18709dba161d1f6e022c8a57fdf0/>PikWizard</a>
</span>
</span>
<span class="image-link">
<span
style="margin: 0 0 20px 0; display: inline-block; vertical-align: middle; width: 100%;"
>
<a
target="_blank"
href="https://pikwizard.com/photo/abstract-dashboard-interface-displaying-data-visualization/bccc18709dba161d1f6e022c8a57fdf0/"
style="text-decoration: none; font-size: 10px; margin: 0;"
>
<img src="https://pikwizard.com/pw/medium/bccc18709dba161d1f6e022c8a57fdf0.jpg" style="margin: 0; width: 100%;" alt="" />
<p style="font-size: 12px; margin: 0;">PikWizard</p>
</a>
</span>
</span>
Free (free of charge)
Free for personal and commercial use.
Author: Authentic Images