
- Home >
- Stock Photos >
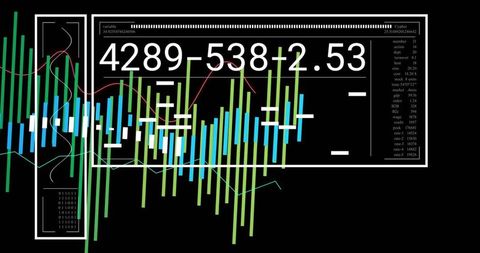
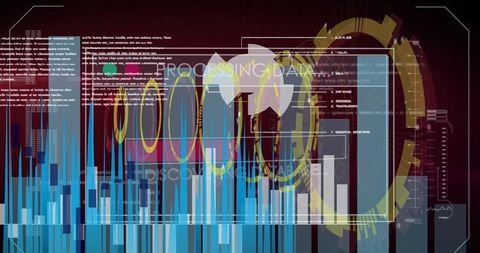
- Abstract Data Analysis and Digital Interface
Abstract Data Analysis and Digital Interface Image

Mixing data processing with geometric shapes creates a sense of innovation and technological advancement. The blue graphs convey precision and analytical depth, embodying concepts of business intelligence and information processing. Ideal for illustrating articles or presentations about technological innovations and modern business solutions. Suitable for visual content in tech-focused conferences or educational resources.
Powered by 


downloads
Tags:
More
Credit Photo
If you would like to credit the Photo, here are some ways you can do so
Text Link
photo Link
<span class="text-link">
<span>
<a target="_blank" href=https://pikwizard.com/photo/abstract-data-analysis-and-digital-interface/357852a923748540ab307030f8967ae0/>PikWizard</a>
</span>
</span>
<span class="image-link">
<span
style="margin: 0 0 20px 0; display: inline-block; vertical-align: middle; width: 100%;"
>
<a
target="_blank"
href="https://pikwizard.com/photo/abstract-data-analysis-and-digital-interface/357852a923748540ab307030f8967ae0/"
style="text-decoration: none; font-size: 10px; margin: 0;"
>
<img src="https://pikwizard.com/pw/medium/357852a923748540ab307030f8967ae0.jpg" style="margin: 0; width: 100%;" alt="" />
<p style="font-size: 12px; margin: 0;">PikWizard</p>
</a>
</span>
</span>
Free (free of charge)
Free for personal and commercial use.
Author: Creative Art
Similar Free Stock Images

Premium


Premium


Premium


Premium


Premium


Premium


Premium


Premium

Premium


Premium


Premium

AI


Premium


Premium

Premium


Premium


Premium


Premium


Premium


Premium


Premium


Premium


Premium


Premium


Premium


Premium


Explore More Free Stock Images