
- Home >
- Stock Photos >
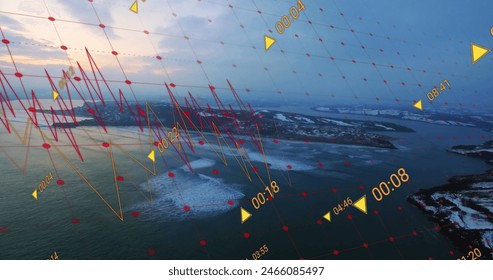
- Abstract Data Analysis Overlay on Coastal Landscape
Abstract Data Analysis Overlay on Coastal Landscape Image

Geographical view creatively overlayed with multi-colored data and graph lines symbolizes data connection with the natural environment. Potential usages include illustrating technological integration in natural ecosystems, conveying future advancements in geographical data analysis, and highlighting global network concepts.
Powered by  - Get 15% off with code: PIKWIZARD15


downloads
Tags:
More
Credit Photo
If you would like to credit the Photo, here are some ways you can do so
Text Link
photo Link
<span class="text-link">
<span>
<a target="_blank" href=https://pikwizard.com/photo/abstract-data-analysis-overlay-on-coastal-landscape/7e5b5cccec07beac968625f8f036cedf/>PikWizard</a>
</span>
</span>
<span class="image-link">
<span
style="margin: 0 0 20px 0; display: inline-block; vertical-align: middle; width: 100%;"
>
<a
target="_blank"
href="https://pikwizard.com/photo/abstract-data-analysis-overlay-on-coastal-landscape/7e5b5cccec07beac968625f8f036cedf/"
style="text-decoration: none; font-size: 10px; margin: 0;"
>
<img src="https://pikwizard.com/pw/medium/7e5b5cccec07beac968625f8f036cedf.jpg" style="margin: 0; width: 100%;" alt="" />
<p style="font-size: 12px; margin: 0;">PikWizard</p>
</a>
</span>
</span>
Free (free of charge)
Free for personal and commercial use.
Author: People Creations
Similar Free Stock Images

Premium


Premium


Premium


Premium


Premium

Premium


Premium


Premium


Premium


Premium


Premium


Premium

Premium


Premium

Premium


Premium


Premium


Premium

Premium


Premium


Premium


Premium

Premium

Premium

Premium


Explore More Free Stock Images