
- Home >
- Stock Photos >
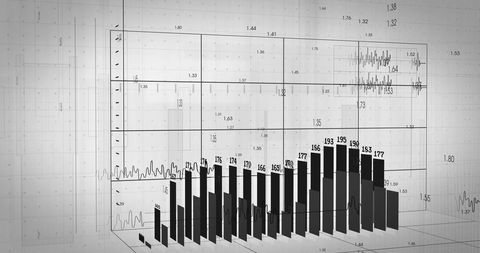
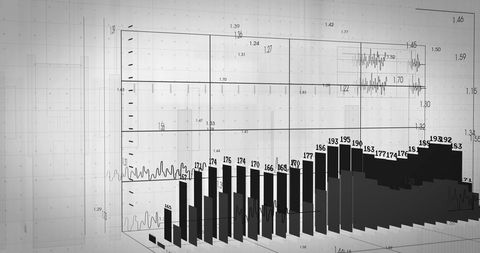
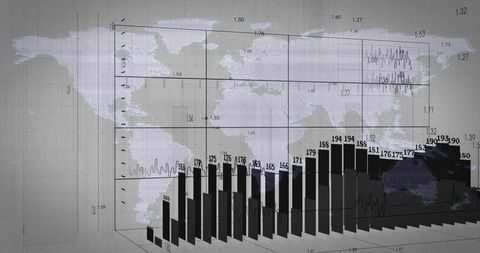
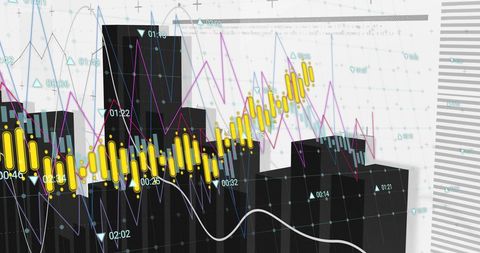
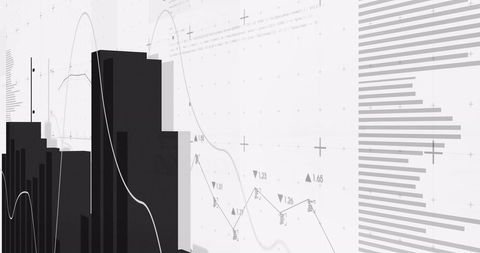
- Abstract Data Analytics and Graphs on White Background
Abstract Data Analytics and Graphs on White Background Image

Features digital representation of data analytics with dark bar graphs and line charts over a white background. Ideal for illustrating concepts related to business statistics, economic analysis, and data processing in reports, business presentations, and educational materials. Great for emphasizing insights in technology-driven business environments.
Powered by  - Get 15% off with code: PIKWIZARD15


downloads
Tags:
More
Credit Photo
If you would like to credit the Photo, here are some ways you can do so
Text Link
photo Link
<span class="text-link">
<span>
<a target="_blank" href=https://pikwizard.com/photo/abstract-data-analytics-and-graphs-on-white-background/f85f02b2831eda6b4901a911950d1cf8/>PikWizard</a>
</span>
</span>
<span class="image-link">
<span
style="margin: 0 0 20px 0; display: inline-block; vertical-align: middle; width: 100%;"
>
<a
target="_blank"
href="https://pikwizard.com/photo/abstract-data-analytics-and-graphs-on-white-background/f85f02b2831eda6b4901a911950d1cf8/"
style="text-decoration: none; font-size: 10px; margin: 0;"
>
<img src="https://pikwizard.com/pw/medium/f85f02b2831eda6b4901a911950d1cf8.jpg" style="margin: 0; width: 100%;" alt="" />
<p style="font-size: 12px; margin: 0;">PikWizard</p>
</a>
</span>
</span>
Free (free of charge)
Free for personal and commercial use.
Author: People Creations
Similar Free Stock Images

Premium


Premium

Premium


Premium

Premium


Premium


Premium


Premium


Premium


Premium


Premium


Premium

Premium

Premium

Premium


Premium


Premium


Premium

Premium


Premium


Premium

Premium

Premium


Premium


Premium

Explore More Free Stock Images