
- Home >
- Stock Photos >
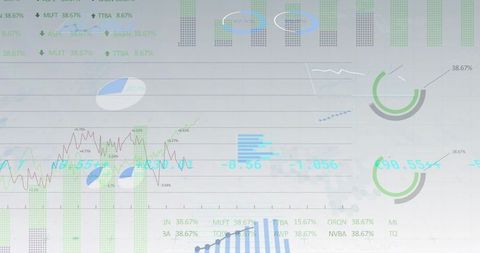
- Abstract Data Analytics Visualization with Numbers and Charts
Abstract Data Analytics Visualization with Numbers and Charts Image

Illustrates a digital representation of data analytics with numbers and charts floating on a soft white background. Suggests the interconnectedness and complexity of global business intelligence and financial technology. Ideal for presentations, articles, or websites focusing on modern data analysis, finance, and the technological world.
Powered by  - Get 15% off with code: PIKWIZARD15


downloads
Tags:
More
Credit Photo
If you would like to credit the Photo, here are some ways you can do so
Text Link
photo Link
<span class="text-link">
<span>
<a target="_blank" href=https://pikwizard.com/photo/abstract-data-analytics-visualization-with-numbers-and-charts/d11effa09c7256e246d9d0e0c08b287a/>PikWizard</a>
</span>
</span>
<span class="image-link">
<span
style="margin: 0 0 20px 0; display: inline-block; vertical-align: middle; width: 100%;"
>
<a
target="_blank"
href="https://pikwizard.com/photo/abstract-data-analytics-visualization-with-numbers-and-charts/d11effa09c7256e246d9d0e0c08b287a/"
style="text-decoration: none; font-size: 10px; margin: 0;"
>
<img src="https://pikwizard.com/pw/medium/d11effa09c7256e246d9d0e0c08b287a.jpg" style="margin: 0; width: 100%;" alt="" />
<p style="font-size: 12px; margin: 0;">PikWizard</p>
</a>
</span>
</span>
Free (free of charge)
Free for personal and commercial use.
Author: Authentic Images
Similar Free Stock Images

Premium


Premium


Premium


Premium


Premium


Premium


Premium


Premium

Premium

Premium


Premium


Premium


Premium


Premium


Premium


Premium

Premium

Premium


Premium


Premium

Premium


Premium


Premium

Premium


Premium


Explore More Free Stock Images