1. Home > 
  2. Free Stock Photos & Images > 
  3. Abstract Data Dashboard Displaying Circular Gauges and Numeric Stock Limits on Grid UI

Abstract Data Dashboard Displaying Circular Gauges and Numeric Stock Limits on Grid UI Free Stock Image

Abstract Data Dashboard Displaying Circular Gauges and Numeric Stock Limits on Grid UI

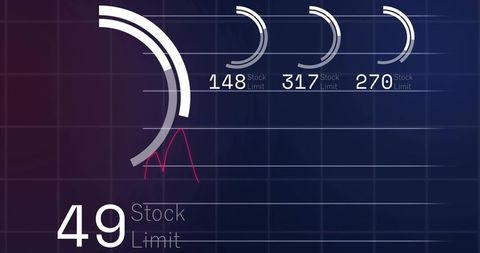
Minimal dark dashboard design featuring large semicircular gauge highlighting numeric value 49 and three smaller radial gauges showing stock limit figures. Suitable for presenting product management reports, monitoring inventory levels, visualizing financial metrics, and tracking performance indicators. Ideal for using in presentation slides, website hero panels, app prototypes, marketing materials, and investor pitch decks. Editable for overlaying custom data, adjusting color palette, and adding branding. High contrast grid and gradient background enhancing legibility and supporting modern technology themes.

Powered by Shutterstock logo - Get 15% off with code: PIKWIZARD15
Data analytics dashboard concept with business person using laptop, showing charts, graphs, and performance metrics for business intelligence and data driven decision making. - Powered by Shutterstock - Get 15% off with code: PIKWIZARD15Business analytics dashboard concept with hands typing on laptop, digital financial charts and data visualization interface, performance metrics, market analysis, growth tracking and strategy insights - Powered by Shutterstock - Get 15% off with code: PIKWIZARD15A captivating image of a hand reaching toward data analytics concepts, highlighting cloud computing, statistics, and the power of big data in modern technology. Tessel - Powered by Shutterstock - Get 15% off with code: PIKWIZARD15AI business intelligence interface featuring real-time AI data visualization, predictive AI model graphs, and automated report tools driven by AI artificial intelligence for business solution. Corpus - Powered by Shutterstock - Get 15% off with code: PIKWIZARD15Businessman analyzes an interactive data dashboard with bar charts, pie charts, KPI and visual reports to evaluate performance, support financial insights, and drive strategic business decisions. - Powered by Shutterstock - Get 15% off with code: PIKWIZARD15

Credit Photo

If you would like to credit the Photo, here are some ways you can do so

Free (free of charge)

Free for personal and commercial use.

Author: Creative Art

Similar Free Stock Images

Geometric Bear on Financial Graph Background
Digital Data Processing Interface with Futuristic Visuals
Financial Data Visualization Over Urban Skyline
Glowing Thunder Icon on Dynamic Financial Charts Background
Premium
Dynamic Financial Growth Chart on Digital Screen
Digital Financial Data with Graphs and Numbers Illustrations
Digital Interface with Cyber Security Icons Overlay
Data Analytics Dashboard with Line Charts and Clock Graphic
Premium
Digital User Notification Icon with Minimalistic Data Background
Abstract Digital Chart with Cyber Grid Background
Abstract Geometric Overlay on Stock Market Data Visualization
Digital Interface Displaying Data Visualization Graphics
Premium
6G Technology with Financial Data Visualization Interface
5G Technology Overlays Financial Data in Digital Concept
Digital Data Visualization with Statistics and Global Maps
Falling Red Line Graph Showing Market Downturn on Futuristic Trading Grid
Premium
Green Line Chart on Digital Grid with Financial Data Points
Digital Data Insights with Futuristic Interface on Dark Grid
6G Network Forecast Visualizing Global Telemetry on Neon Green Holographic Analytics Grid
Overlaying white smartphone icon on dark blue financial chart grid with multicolor line charts
Premium
Digital Currency Symbols on Dark Grid Background
Rising Sea Levels Impacting Economy Global Warming Concept
Digital Interface with Analytics Graphs and Pie Chart Visualization
Digital Stock Market Analysis on Futuristic Office Model
Premium
Futuristic Financial Data Visualization
Futuristic Digital Interface with Infographic and Data Trends
Dynamic Speedometer with City Rush Visualization
Economic Downturn in Festive Context with Easter Eggs
Premium
Abstract Financial Data Visualization in Digital Display
Digital Data Transfer with Encrypted Processing Banner
Digital Financial Data and Analytics over Urban Cityscape
Digitally Generated Image of Coding Concepts and Technology
Premium
Floating Numbers Over Cityscape Representing Statistical Analysis
Futuristic Financial Screen Displaying Bar Graphs and Lightning Bolt Symbol
Abstract Financial Data Visualization on Purple Grid
Futuristic 6G Technology Concept with Data Visualization Interface
Premium
Digital Interface with Currency Symbols and Data Analytics
Futuristic Financial Data Analysis Interface Concept
Dynamic Financial Data Charts and Graphs Background
Dynamic Financial Graphs Illustrating Business Growth
Premium
Displaying futuristic financial dashboard panels with 2005 and 2014 market timelines
Global Financial Data and Graph Analysis Technology
6G network concept showing wireframe globe, data charts and neon grid for telecom
Futuristic Data Interface with Globe and Graphs on Black Background
Premium
Digital Dashboard Analytics Graphic Illustrating Trends
Digital Security Illustration with Graph and Binary Codes
Financial Chart with Dynamic Numbers on Grid Background
Abstract Digital Interface with Data Analytics Chart Elements
Premium
Futuristic data dashboard displaying central HUD, analytics graphs and interface icons
Digital Battery Icon With Technology Interface
Digital Data Recovery Interface with Loading Effect
Digital Finance and Data Visualization Concept with Growing Chart
Premium
Abstract Financial Data Analysis on Dark Grid Background
Digital Interface Displaying Data Processing Analytics on Black Background
Futuristic Data Recovery Concept on Digital Interface
5G Technology Unlocking New Financial Data Horizons
Premium
Social Media Analytics Dashboard Showing Real-Time Likes Comments Followers on 3D Grid
Malware Alert on Digital Interface with Glitch Effects
Bright Green Sales Statistics on Futuristic Grid Display
Digital Display of Financial Data and Statistics
Premium
Digital 6G Network Technology on Globe Background
Global Connectivity with Innovative 6G Network Technology
Abstract Financial Data Visualization with Floating Numbers
Financial Market Decline on Digital Screen With Red Line Graph
Premium
Displaying 6G Wireframe Globe with Analytics Graphs on Digital Network Dashboard
Abstract Cryptocurrency Strategy and Data Analysis Interface
Dynamic Stock Market Data on Graphical Display
Displaying Layered Financial Dashboard with Candlestick Bars and Curved Trend Lines
Premium
Dynamic Financial Data Display with Growth Charts and Symbols
Digital Hologram with Dynamic Numbers on Graph Grid
Futuristic Digital Scanners Analyzing Stock Market Trends
Neon Global Data Visualization with Vertical Metrics Bars on Dark Grid World Dashboard
Premium
Rising Sea Levels Impact Financial Trajectories Concept
Dynamic Financial Data with Red Line on Digital Interface
Social Media Alerts Catalysts of Financial Analytics Trends
Futuristic Interface Highlighting Encrypted Data Transfer
Premium
Data Flow Interface: Visualization of Encrypted Transfer Analysis
Eye Chart with Digital Data Integration Visualizing Business Trends
Data Processing Concepts with Encrypted Transmission Overlay
Neon Music Text with Geometric Grid Background
Premium
Displaying Multi-layer HUD Analytics UI with Neon Line Charts and Isometric Wireframe
Futuristic Data Processing with Speedometer and Digital Interface
Dynamic Financial Data Analysis Illustration
Financial Data and Graphs with Futuristic Interface
Premium
Digital Network Speedometer Displaying Data Transmission
Neon Clock with Data Visualization on Blue Background
Digital Data Processing and Global Connectivity Abstract Background
Global Financial Data Interface with Dynamic ASM
Premium
Global Financial Growth Represented by Digital Metrics
Digital Data Analysis and Mathematical Overlay
Global Economy Business Data Visualization Background
5G Technology Concept with Data and Analytics Background
Premium
Digital Security Concept with Padlock and Data Analytics
Futuristic Digital Interface with Data Algorithms in Motion
Red trend line on dark digital dashboard displaying streaming binary code, grid and axes
Futuristic HUD Interface with Circular Chart and Line Graph
Premium
Futuristic HUD cockpit displaying holographic telemetry, navigation and green performance graph
Displaying central digital speed gauge 92 km/h with neon telemetry overlays and chart graphics
Futuristic Data Analytics and Digital Interface Overlay
Floating Chat Notification Badge Showing 25 on Dark Grid Neon UI Dashboard
Premium
Explore More Free Stock Images