- Home >
- Stock Photos >
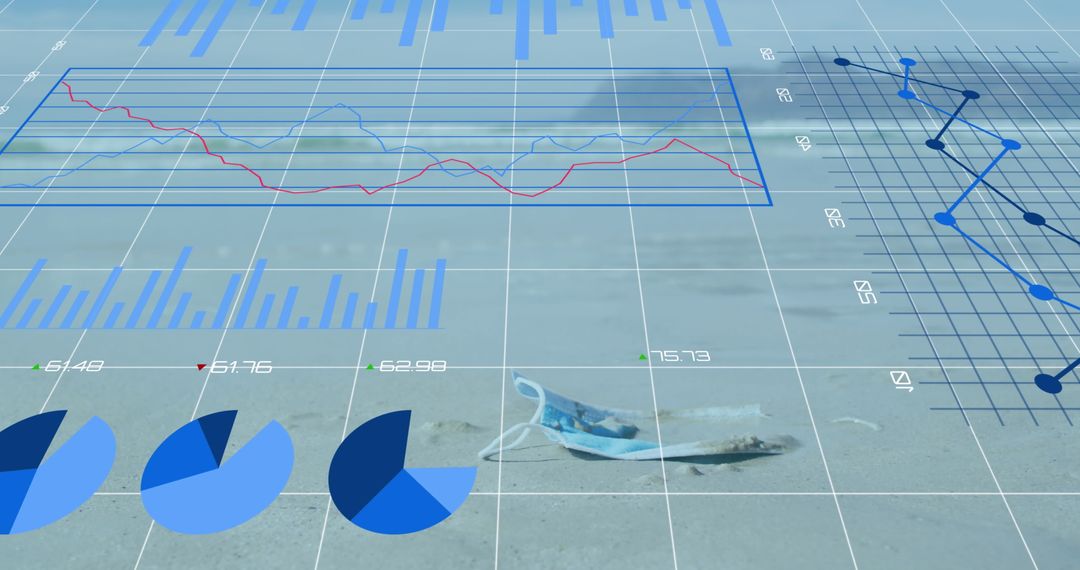
- Abstract Data Dashboard with Bar Charts and Analytics Visualization
Abstract Data Dashboard with Bar Charts and Analytics Visualization Image

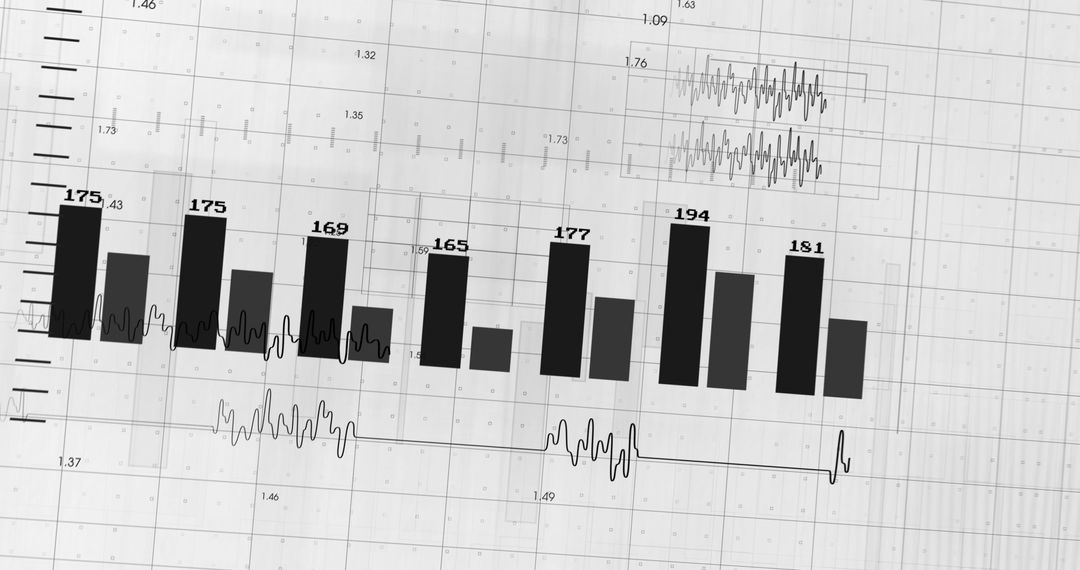
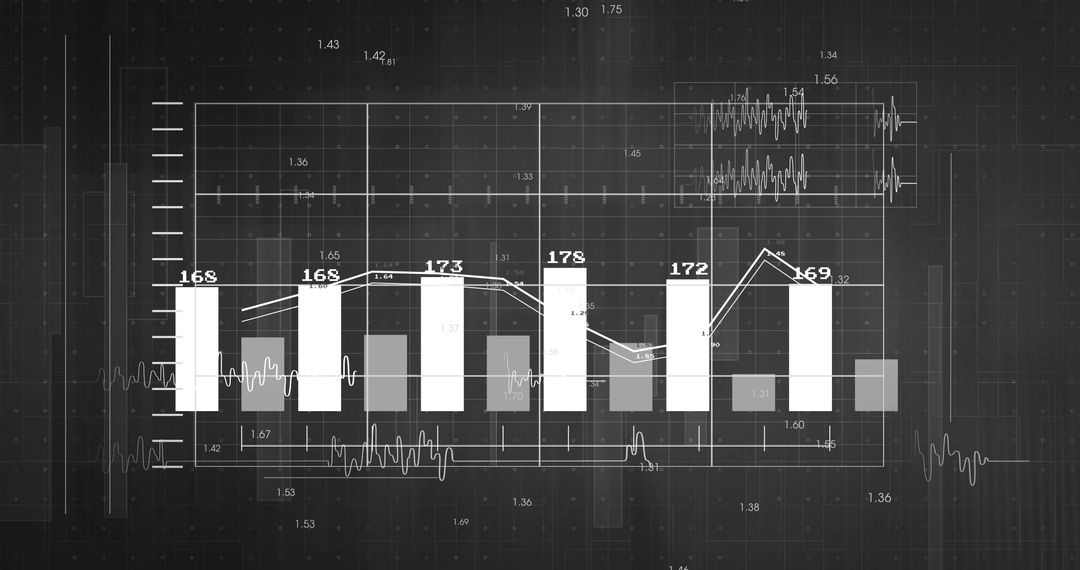
Digital interface illustrating complex data flow across a structured dashboard. White bar charts complemented by dynamic red highlights denote analytics segments, conveying a sense of real-time data processing. Ideal for use in presentations about modern technology, financial analysis, data science concepts, or digital transformation in industries. Suitable as a visual aid for teaching data analytics and information technology.
Powered by 


0
downloads
downloads
Tags:
More
Credit Photo
If you would like to credit the Photo, here are some ways you can do so
Text Link
photo Link
<span class="text-link">
<span>
<a target="_blank" href=https://pikwizard.com/photo/abstract-data-dashboard-with-bar-charts-and-analytics-visualization/49e5429760c1ce257b18207576efe308/>PikWizard</a>
</span>
</span>
<span class="image-link">
<span
style="margin: 0 0 20px 0; display: inline-block; vertical-align: middle; width: 100%;"
>
<a
target="_blank"
href="https://pikwizard.com/photo/abstract-data-dashboard-with-bar-charts-and-analytics-visualization/49e5429760c1ce257b18207576efe308/"
style="text-decoration: none; font-size: 10px; margin: 0;"
>
<img src="https://pikwizard.com/pw/medium/49e5429760c1ce257b18207576efe308.jpg" style="margin: 0; width: 100%;" alt="" />
<p style="font-size: 12px; margin: 0;">PikWizard</p>
</a>
</span>
</span>
Free (free of charge)
Free for personal and commercial use.
Author: Creative Art
Similar Free Stock Images

Premium


Premium


Premium


Premium


Premium


Premium


Premium


Premium


Premium


Premium


Premium


Premium


Premium


Premium


Premium


Premium


Premium


Premium


Premium


Premium


Premium


Premium


Premium


Premium