
- Home >
- Stock Photos >
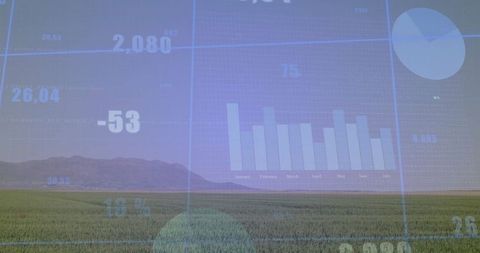
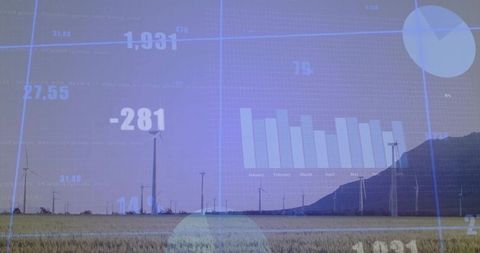
- Abstract Data Dashboard with Graphs and Charts
Abstract Data Dashboard with Graphs and Charts Image

Abstract depiction of dashboard focusing on data visualization with bar charts, pie slices, and numerical overlays. Perfect for use in technology, business intelligence, data analytics, or financial report presentations. Relevant for articles and blogs related to future-forward analytics tools.
Powered by  - Get 15% off with code: PIKWIZARD15


downloads
Tags:
More
Credit Photo
If you would like to credit the Photo, here are some ways you can do so
Text Link
photo Link
<span class="text-link">
<span>
<a target="_blank" href=https://pikwizard.com/photo/abstract-data-dashboard-with-graphs-and-charts/90877efb6afdda321fad74a251aa6e30/>PikWizard</a>
</span>
</span>
<span class="image-link">
<span
style="margin: 0 0 20px 0; display: inline-block; vertical-align: middle; width: 100%;"
>
<a
target="_blank"
href="https://pikwizard.com/photo/abstract-data-dashboard-with-graphs-and-charts/90877efb6afdda321fad74a251aa6e30/"
style="text-decoration: none; font-size: 10px; margin: 0;"
>
<img src="https://pikwizard.com/pw/medium/90877efb6afdda321fad74a251aa6e30.jpg" style="margin: 0; width: 100%;" alt="" />
<p style="font-size: 12px; margin: 0;">PikWizard</p>
</a>
</span>
</span>
Free (free of charge)
Free for personal and commercial use.
Author: People Creations
Similar Free Stock Images

Premium

Premium

Premium


Premium


Premium


Premium


Premium


Premium

Premium


Premium


Premium


Premium


Premium


Premium

Premium


Premium


Premium


Premium


Premium


Premium

Premium


Premium


Premium


Premium

Premium


Explore More Free Stock Images