
- Home >
- Stock Photos >
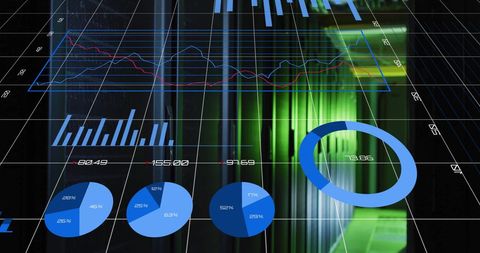
- Abstract Data Processing Dashboard with Digital Graphs
Abstract Data Processing Dashboard with Digital Graphs Image

Shows a futuristic digital interface depicting graphs and data visualizations. Useful for illustrating concepts related to data management, financial analysis, global business strategies, technological innovation, and digital computing environments. Ideal for business presentations, financial publications, or website headers on tech topics.
Powered by 


downloads
Tags:
More
Credit Photo
If you would like to credit the Photo, here are some ways you can do so
Text Link
photo Link
<span class="text-link">
<span>
<a target="_blank" href=https://pikwizard.com/photo/abstract-data-processing-dashboard-with-digital-graphs/7c671d84254449c0bb2226ad6f100691/>PikWizard</a>
</span>
</span>
<span class="image-link">
<span
style="margin: 0 0 20px 0; display: inline-block; vertical-align: middle; width: 100%;"
>
<a
target="_blank"
href="https://pikwizard.com/photo/abstract-data-processing-dashboard-with-digital-graphs/7c671d84254449c0bb2226ad6f100691/"
style="text-decoration: none; font-size: 10px; margin: 0;"
>
<img src="https://pikwizard.com/pw/medium/7c671d84254449c0bb2226ad6f100691.jpg" style="margin: 0; width: 100%;" alt="" />
<p style="font-size: 12px; margin: 0;">PikWizard</p>
</a>
</span>
</span>
Free (free of charge)
Free for personal and commercial use.
Author: Creative Art
Similar Free Stock Images

Premium


Premium


Premium


Premium


Premium


Premium

Premium


Premium

Premium


Premium


Premium


Premium

Premium


Premium

Premium


Premium


Premium

Premium


Premium


Premium


Premium


Premium


Premium


Premium


Premium

Explore More Free Stock Images