
- Home >
- Stock Photos >
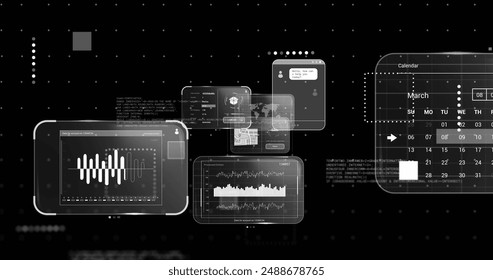
- Abstract Data Processing with Charts and Graphs
Abstract Data Processing with Charts and Graphs Image

Abstract representation of data processing with charts and graphs overlapping on a blue background. This visual can be applied in financial analytics, business presentations, tech workshops, and educational materials, emphasizing analytics and global business technology themes.
Powered by  - Get 15% off with code: PIKWIZARD15


downloads
Tags:
More
Credit Photo
If you would like to credit the Photo, here are some ways you can do so
Text Link
photo Link
<span class="text-link">
<span>
<a target="_blank" href=https://pikwizard.com/photo/abstract-data-processing-with-charts-and-graphs/ed2f34bc0521a9a75ba5aa863765409c/>PikWizard</a>
</span>
</span>
<span class="image-link">
<span
style="margin: 0 0 20px 0; display: inline-block; vertical-align: middle; width: 100%;"
>
<a
target="_blank"
href="https://pikwizard.com/photo/abstract-data-processing-with-charts-and-graphs/ed2f34bc0521a9a75ba5aa863765409c/"
style="text-decoration: none; font-size: 10px; margin: 0;"
>
<img src="https://pikwizard.com/pw/medium/ed2f34bc0521a9a75ba5aa863765409c.jpg" style="margin: 0; width: 100%;" alt="" />
<p style="font-size: 12px; margin: 0;">PikWizard</p>
</a>
</span>
</span>
Free (free of charge)
Free for personal and commercial use.
Author: People Creations
Similar Free Stock Images

Premium


Premium
Premium


Premium


Premium


Premium


Premium


Premium


Premium


Premium


Premium


Premium


Premium


Premium


Premium


Premium


Premium


Premium


Premium


Premium


Premium


Premium


Premium


Premium


Premium


Explore More Free Stock Images