
- Home >
- Stock Photos >
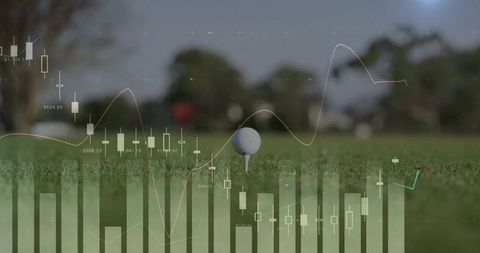
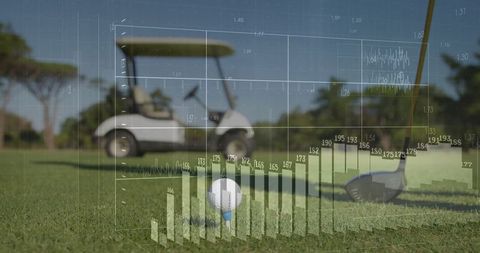
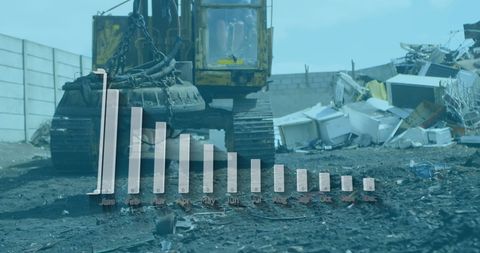
- Abstract Data Visual Representation with Growth Chart and Error Codes
Abstract Data Visual Representation with Growth Chart and Error Codes Image

This visual conveys the complex nature of data analytics using 3D bars and a curves graph alongside various city error codes. The image symbolizes financial growth and warning signals, and it illustrates data-driven decision-making processes. Suitable for business presentations focusing on market analysis and predictive modeling, or as a background in financial services contexts.
Powered by 


downloads
Tags:
More
Credit Photo
If you would like to credit the Photo, here are some ways you can do so
Text Link
photo Link
<span class="text-link">
<span>
<a target="_blank" href=https://pikwizard.com/photo/abstract-data-visual-representation-with-growth-chart-and-error-codes/1815ae483adbb45128061639d64be022/>PikWizard</a>
</span>
</span>
<span class="image-link">
<span
style="margin: 0 0 20px 0; display: inline-block; vertical-align: middle; width: 100%;"
>
<a
target="_blank"
href="https://pikwizard.com/photo/abstract-data-visual-representation-with-growth-chart-and-error-codes/1815ae483adbb45128061639d64be022/"
style="text-decoration: none; font-size: 10px; margin: 0;"
>
<img src="https://pikwizard.com/pw/medium/1815ae483adbb45128061639d64be022.jpg" style="margin: 0; width: 100%;" alt="" />
<p style="font-size: 12px; margin: 0;">PikWizard</p>
</a>
</span>
</span>
Free (free of charge)
Free for personal and commercial use.
Author: Authentic Images
Similar Free Stock Images

Premium


Premium


Premium


AI

Premium

Premium


Premium


Premium


Premium


Premium

Premium


Premium


Premium


Premium

Premium

Premium


Premium

Premium


Premium


Premium


Premium


Premium


Premium


Premium


Premium


Premium


Explore More Free Stock Images