
- Home >
- Stock Photos >
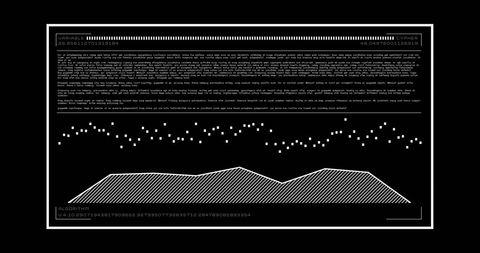
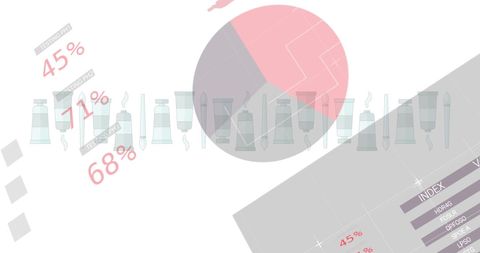
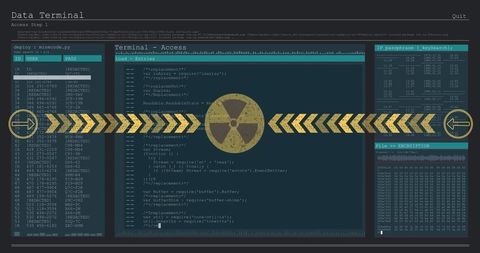
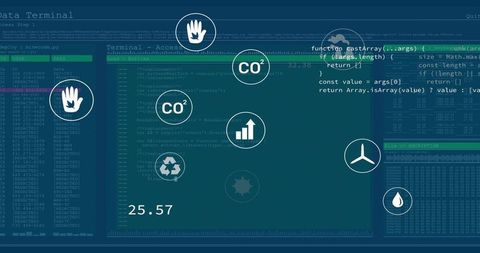
- Abstract Data Visualization and Infographics Interface
Abstract Data Visualization and Infographics Interface Image

Digitally generated depiction of data processing and visual analytics, offering a modern and dynamic way to represent business information. Useful for business presentations, educational materials, and tech blog visuals about data analysis, technology solutions, and global business trends.
Powered by  - Get 15% off with code: PIKWIZARD15


downloads
Tags:
More
Credit Photo
If you would like to credit the Photo, here are some ways you can do so
Text Link
photo Link
<span class="text-link">
<span>
<a target="_blank" href=https://pikwizard.com/photo/abstract-data-visualization-and-infographics-interface/cc653c118828b7e2a641338d9ebb99ee/>PikWizard</a>
</span>
</span>
<span class="image-link">
<span
style="margin: 0 0 20px 0; display: inline-block; vertical-align: middle; width: 100%;"
>
<a
target="_blank"
href="https://pikwizard.com/photo/abstract-data-visualization-and-infographics-interface/cc653c118828b7e2a641338d9ebb99ee/"
style="text-decoration: none; font-size: 10px; margin: 0;"
>
<img src="https://pikwizard.com/pw/medium/cc653c118828b7e2a641338d9ebb99ee.jpg" style="margin: 0; width: 100%;" alt="" />
<p style="font-size: 12px; margin: 0;">PikWizard</p>
</a>
</span>
</span>
Free (free of charge)
Free for personal and commercial use.
Author: People Creations
Similar Free Stock Images
Premium


Premium


Premium


Premium


Premium


Premium


Premium


Premium

Premium

Premium


Premium


Premium


Premium


Premium

Premium

Premium


Premium

Premium


Premium


Premium

Premium

Premium


Premium


Premium


Premium


Explore More Free Stock Images