- Home >
- Stock Photos >
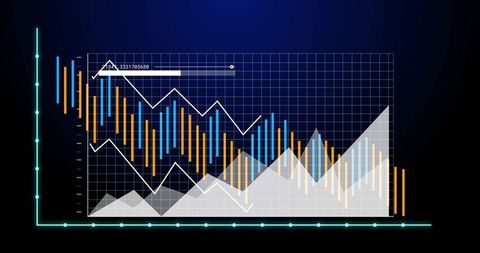
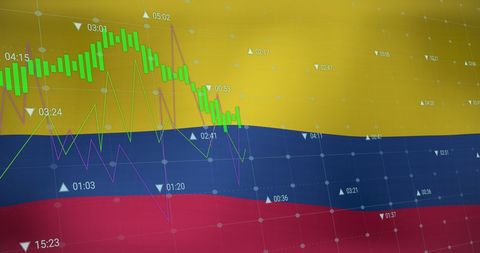
- Abstract Data Visualization Digital Chart Background
Abstract Data Visualization Digital Chart Background Image

Colorful abstract chart overlaid with various metrics. Used in business and technology presentations, websites representing data analysis, digital interfaces, or economic reports.

downloads
Tags:
More
Credit Photo
If you would like to credit the Photo, here are some ways you can do so
Text Link
photo Link
<span class="text-link">
<span>
<a target="_blank" href=https://pikwizard.com/photo/abstract-data-visualization-digital-chart-background/9d1d1ed14fc1d4b7515500e1342cec26/>PikWizard</a>
</span>
</span>
<span class="image-link">
<span
style="margin: 0 0 20px 0; display: inline-block; vertical-align: middle; width: 100%;"
>
<a
target="_blank"
href="https://pikwizard.com/photo/abstract-data-visualization-digital-chart-background/9d1d1ed14fc1d4b7515500e1342cec26/"
style="text-decoration: none; font-size: 10px; margin: 0;"
>
<img src="https://pikwizard.com/pw/medium/9d1d1ed14fc1d4b7515500e1342cec26.jpg" style="margin: 0; width: 100%;" alt="" />
<p style="font-size: 12px; margin: 0;">PikWizard</p>
</a>
</span>
</span>
Free (free of charge)
Free for personal and commercial use.
Author: People Creations