1. Home > 
  2. Stock Photos > 
  3. Abstract Data Visualization on Black Background Financial Insights Concept

Abstract Data Visualization on Black Background Financial Insights Concept Image

Abstract Data Visualization on Black Background Financial Insights Concept

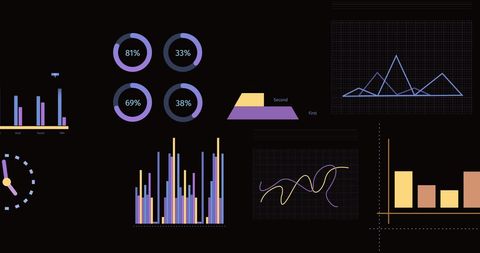
Visualizing abstract data with diverse charts, pie graphs, and analytical content on a black background enhances modern business materials. Use for analytics presentations, financial reports, or digital marketing strategies to convey data creatively and powerfully.

Powered by Shutterstock logo - Get 15% off with code: PIKWIZARD15
Big data technology and data science. Data scientist querying, analysing and visualizing complex set on virtual screen. Data flow concept. Neural network, artificial intelligence, ML, analytics. - Powered by Shutterstock - Get 15% off with code: PIKWIZARD15Data science and big data technology. Scientist computing, analysing and visualizing complex data set on computer. Data mining, artificial intelligence, machine learning, business analytics. - Powered by Shutterstock - Get 15% off with code: PIKWIZARD15Analyzing Key Performance Indicators. Businessman using digital screen to analyze key performance indicators (KPI) with various graphs and charts, showcasing data analysis and performance tracking. - Powered by Shutterstock - Get 15% off with code: PIKWIZARD15Big data analytics with AI technology. Data analyst analyzing and visualizing complex information network with artificial intelligence. Machine learning algorithm for business analytics and finance. - Powered by Shutterstock - Get 15% off with code: PIKWIZARD15Data and AI Powering Global Analytics: Visualize data-driven insights with AI and big data, showcasing global networks, large language models, artificial neural network and digital transformation. - Powered by Shutterstock - Get 15% off with code: PIKWIZARD15

Credit Photo

If you would like to credit the Photo, here are some ways you can do so

Free (free of charge)

Free for personal and commercial use.

Author: Creative Art

Similar Free Stock Images

Digital Financial Data Interface with Analytics
Premium
Analyst team utilizing BI Fintech to analyze financial report with tablet over paper on table and analyzing BI power dashboard display on tablet screen for business insight. Panorama shot. Scrutinize
Visionary Financial Data Analysis on Digital Interface
Financial Data Chart Over City Silhouette
Red Line Graph Over Histogram Representing Financial Volatility
Futuristic Data Visualization Chart with Digital Mountain Peaks
Premium
Hand holding smartphone displays data visualizations, including histogram and pie chart. Analytics, digital transformation and increasing use of mobile technology in business. Minimalist art collage.
Digital Financial Data Display with Graphs and Analytics
Digital Financial Data Analysis with Graphs and Charts
Digital Icons on Data Grid Network Depicting Business Concepts
Stylized Graphs and Charts on White Background for Data Analysis Concepts
Premium
Big data analysis with AI technology for business analytics. Insights from data mining, filtering, sorting, clustering. Data scientist working on machine learning on virtual computer screen.
Digital Financial Data Processing and Analysis Graphics
Digital Interface Displaying Global Finance Data Charts
Abstract Financial Data Processing Interface
Digital Data Analytics with Financial Graphs and Indigo Background
Premium
Data science and big data technology.  Big data analytics visualizing on touchscreen. Data mining.
Financial Graphs and World Map Illustrating Market Data
Financial Data Processing Visualization on Dark Background
Digital Data Visualization with Graph Charts on Dark Background
Financial Data Processing Over Digital Interface and Graphs
Premium
Panorama shot analyst team utilizing BI Fintech to analyze financial report with laptop. Businesspeople analyzing BI power dashboard displayed on laptop screen for business insight. Scrutinize
Data Processing with Abstract Graph and Digital Interface
Futuristic Financial Data Analysis with Graphs and Charts
Futuristic Financial Data Analysis Interface Concept
Dynamic Financial Data with Fluctuating Graph Lines
Premium
Big data analysed with AI technology for business analytics. Getting insights from data mining, filtering, sorting, clustering. Data scientist working on visualization on virtual computer screen.
Financial Graph Showing Indices Trends on Blue Background
Futuristic Digital Dashboard Interface with Analytics Graphics
Futuristic Data Visualization with Vertical Bar Charts
Digital Dashboard with Data Trends and Chat Technology Elements
Dynamic Digital Data Visualization with Graphs and Statistics
Digital Financial Data Analysis with Graphs and Charts on Black Background
Premium
Man look at the dashboard with graphs and charts. Concept of data management system, business intelligence, data statistics, marketing analysis, key performance indicators (KPI) and analytics.
Digital Data Analysis Against Abstract Cityscape
Fluctuating Financial Graph With Data Visualization
Digital Data Processing Dashboard in Global Connection Visualization
Dynamic Financial Data Analysis with Virtual Screen
Premium
Data science and big data technology. Engineer computing, analysing and visualizing complex data stream on computer. Data mining, artificial intelligence, machine learning, business analytics.
Futuristic Financial Data Visualization
Colorful Financial Graphs and Analytics on Black Background
Abstract Financial Data and Statistics Visualization Concept
Colorful Data Analytics and Statistics Conceptual Graphics
Premium
Big data and analytics visualization technology with scientist analyzing information structure on screen with machine learning to extract predictions for business, finance, internet of things
Creative Light Bulb Maze for Data Processing and Analysis
Futuristic Data Processing Interface on Blue Background
Abstract Graphic Business Data Visualization
Digital Icons with Financial Data Overlay on Blue Background
Premium
Explore dynamic world of data visualization image advanced analytics tools, representing real-time data insights and trends in digital landscape
Financial Data Charts & Analysis on Dark Screen
Dynamic Digital Data Processing and Analysis Graphs
Digital Stock Market Data and Trends Visualization
Financial Data Analysis with Graphs and Charts on Dark Background
Premium
Pursuing Financial Mastery: Hands Grasping Insights from Charts and Graphs in Office Context
Digital Financial Data Analysis on Futuristic Blue Interface
Digital Dashboard with Interactive Data Charts on Black Background
Financial Data Processing with Charts and Graphics on Digital Blue Background
Digital Data Processing with Bar and Line Graphs
Premium
Predictive analytics, data visualization,   business forecasting concept. Data analytics for continuous improvement and business development. Predictions about future outcomes and performance.
Dynamic Data Visualization with Interactive Charts and Graphs
Futuristic Digital Interface with Data Visualization and C++ Code
Cybersecurity Dashboard With Data and Code Elements Display
Digital Financial Data Visualizations on Black Background
Dynamic Financial Data Processing in Modern Analytics
Financial Analytics Data Visualization with Graphs and Charts
Premium
Man look at the dashboard with graphs and charts. Concept of data management system, business intelligence, data statistics, marketing analysis, key performance indicators (KPI) and analytics.
Abstract Financial Graphs and Data Analysis
Dynamic Data Visualization Depicting Financial Growth Trends
Digital Data Analysis with Futuristic Charts
Digital Interface Displaying Stock Market Data and Statistics
Premium
Data analysis science and big data with AI technology. An analyst or Scientist uses a computer and dashboard to analyze information on complex data sets on a computer. Insights development engineer.
Colorful Data Analytics Representations on Purple Background
Innovative Data Visualizations with Graphs and Charts
Graph Showing Stock Market Activity and Financial Data Analysis
Finance and Technology Concept with Holographic Graphs
Premium
Big data analytics visualizing. Data science and big data technology on virtual screen.
Stock Market Analysis Digital Screen with Graphs and Trends
Digital Interface Showing Data Analytics with Graphs and Charts
Digital Financial Data Analytics on Dark Interface
Stock Market Analysis and Data Processing Graphic
Premium
Big data analytics visualization technology with scientist analyzing information structure on screen with machine learning to extract strategical prediction for business, finance, internet of things
Digital Projection of Financial Data with Bar Graphs
Digital Financial Data Analysis on Dark Background
Global Financial Data and Stock Market Trends on World Map
Digital Display of Financial Data and Statistics
Premium
Candid of young attractive asian thai man busy work multiple screen computer or smart tablet on table desk at home in freelance data analyst, data science scientist for business.
Visualizing Financial Data Overlaying AI Conceptual Brain
Digital Data Stream with Code Overlay on Technical Graph
Data Analysis Charts and Graphs on Digital Interface
Dynamic Digital Stock Market Chart with Growing Financial Trends
Premium
Investment data analysis with interactive financial dashboards and charts for performance insights, planning, and ROI tracking. Ideal for fintech platforms, economic review, and digital forecasting.
Futuristic Data Dashboard with Graphs and Numeric Visuals
Displaying data dashboard with circular progress rings, teal bars and lavender trend line
Abstract Financial Data Charts and Graphs on Black Background
Digital Financial Charting and Data Processing on Black Background
Cityscape Enhances Financial Data Visualization Digital Concept
Financial Graph Over Cityscape Depicting Data Trends and Analytics
Premium
Big data technology and data science with person touching data flowing on virtual screen. Business analytics, artificial intelligence, machine learning. Engineer or scientist analyzing stream of data.
Digital Financial Graph with Rising Line Trend on Dark Background
Abstract Triangular Shape over Stock Market Data Visualization
Financial Chart Analysis and Data Visualization Concept
Digital Financial Data Processing Interface on Red Background
Premium
Big data technology and data science. Data scientist querying, analysing and visualizing complex information on virtual screen. Data flow concept. Business analytics, finance, neural network, AI, ML.
Diverse Data Visualization Techniques on White Background
Digital Stock Market Chart and Networking Interface
Dynamic Financial Data Analytics Display with Graphs
Financial Data Visualization with Futuristic Interface
Premium
Big data technology and data science. Data scientist analysing and visualizing complex data set on virtual screen. Computing, genomics, artificial intelligence, machine learning, business analytics.
Digital Interface with Data Analysis Graphics on Blue Background
Analyzing Digital Graphs Highlighting Financial Data Trends
Financial Data Analysis with Digital Graph Overlay
Financial Data Analytics with Graphs and statistics
Premium
Financial chart and investment graph analysis stock on tablet screen. Data dashboard and report insight for finance growth, stock market, and business performance strategy.
Digital Financial Graphs and Data Analysis Visualization
Stock Market Analysis with Graphs and Trading Data
Financial Data Analytics on Digital Interface
Digital Data Processing with Technology Interface on Blue Background
Premium
Professional woman interacting with digital sales dashboard displaying various charts and graphs in modern office
Financial Growth Bar and Line Graph on Digital Background
Dynamic Changing Data Visualization in Digital Dashboard
Digital Graph Interface Illustrating Financial Data Analysis
Futuristic Dashboard with Rising Line Chart in Digital Interface
Premium
Budget vs. Actual: Business Financial Review Concept
Dark Analytics Dashboard Displaying Financial Charts, Metrics and Neon Interface