
- Home >
- Stock Photos >
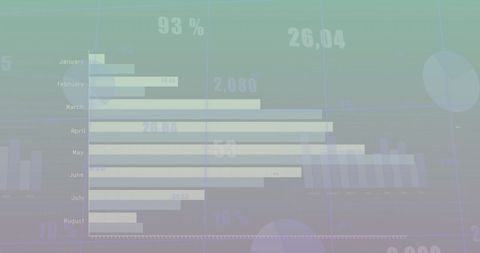
- Abstract Data Visualization on Blue Background
Abstract Data Visualization on Blue Background Image

This abstract graphic showcases a data visualization composed of horizontal bar charts and percentages overlayed on a blue background. Perfect for representing data analytics, financial reports, or tech industry themes on business presentations, digital dashboards, and educational materials.
Powered by 


downloads
Tags:
More
Credit Photo
If you would like to credit the Photo, here are some ways you can do so
Text Link
photo Link
<span class="text-link">
<span>
<a target="_blank" href=https://pikwizard.com/photo/abstract-data-visualization-on-blue-background/e81641b45a62f1c635e40076c30a9826/>PikWizard</a>
</span>
</span>
<span class="image-link">
<span
style="margin: 0 0 20px 0; display: inline-block; vertical-align: middle; width: 100%;"
>
<a
target="_blank"
href="https://pikwizard.com/photo/abstract-data-visualization-on-blue-background/e81641b45a62f1c635e40076c30a9826/"
style="text-decoration: none; font-size: 10px; margin: 0;"
>
<img src="https://pikwizard.com/pw/medium/e81641b45a62f1c635e40076c30a9826.jpg" style="margin: 0; width: 100%;" alt="" />
<p style="font-size: 12px; margin: 0;">PikWizard</p>
</a>
</span>
</span>
Free (free of charge)
Free for personal and commercial use.
Author: Awesome Content
Similar Free Stock Images

Premium


Premium

Premium


Premium


Premium


Premium


Premium


Premium


Premium


Premium


Premium


Premium


Premium


Premium

Premium


Premium


Premium


Premium


Premium


Premium


Premium


Premium


Premium


Premium


Premium


Explore More Free Stock Images