
- Home >
- Stock Photos >
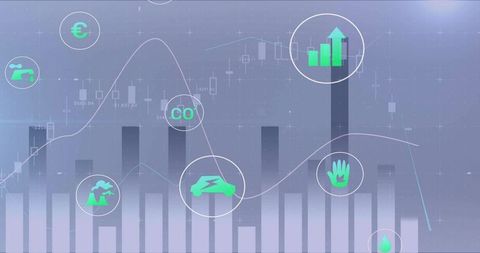
- Abstract Data Visualization with Bars and Circular Elements
Abstract Data Visualization with Bars and Circular Elements Image

Abstract illustration depicting data visualization with bar graphs and overlaying circular digital elements on a blue background. Suitable for presentations on data analytics, modern technology, financial reports, and digital interface design. Enhances conceptual graphics for business insights and technological processes.
Powered by  - Get 15% off with code: PIKWIZARD15


downloads
Tags:
More
Credit Photo
If you would like to credit the Photo, here are some ways you can do so
Text Link
photo Link
<span class="text-link">
<span>
<a target="_blank" href=https://pikwizard.com/photo/abstract-data-visualization-with-bars-and-circular-elements/033d6d3e584b00a50c878f4f8b0305fd/>PikWizard</a>
</span>
</span>
<span class="image-link">
<span
style="margin: 0 0 20px 0; display: inline-block; vertical-align: middle; width: 100%;"
>
<a
target="_blank"
href="https://pikwizard.com/photo/abstract-data-visualization-with-bars-and-circular-elements/033d6d3e584b00a50c878f4f8b0305fd/"
style="text-decoration: none; font-size: 10px; margin: 0;"
>
<img src="https://pikwizard.com/pw/medium/033d6d3e584b00a50c878f4f8b0305fd.jpg" style="margin: 0; width: 100%;" alt="" />
<p style="font-size: 12px; margin: 0;">PikWizard</p>
</a>
</span>
</span>
Free (free of charge)
Free for personal and commercial use.
Author: People Creations
Similar Free Stock Images

Premium


Premium


Premium

Premium


Premium

Premium


Premium


Premium

Premium


Premium


Premium

Premium


Premium


Premium


Premium

Premium

Premium


Premium


Premium


Premium


Premium


Premium


Premium


Premium


Premium

Explore More Free Stock Images