
- Home >
- Stock Photos >
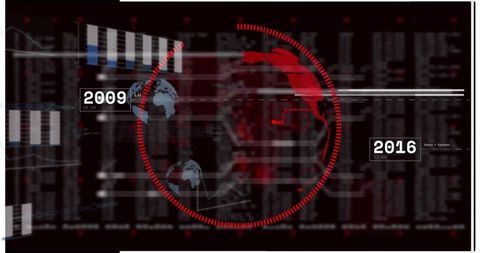
- Abstract Data Visualization with Charts Overlay on Dark Interface
Abstract Data Visualization with Charts Overlay on Dark Interface Image

This impactful composition showcases various data visualizations including bar charts and radar graphs on a dark themed digital interface. Ideal for illustrating concepts in analytics, big data, or technology consultation, it suits marketing materials, business reports, and tech presentations.
Powered by 


downloads
Tags:
More
Credit Photo
If you would like to credit the Photo, here are some ways you can do so
Text Link
photo Link
<span class="text-link">
<span>
<a target="_blank" href=https://pikwizard.com/photo/abstract-data-visualization-with-charts-overlay-on-dark-interface/aa79bd32e46dc9a98a50e94d3d0511de/>PikWizard</a>
</span>
</span>
<span class="image-link">
<span
style="margin: 0 0 20px 0; display: inline-block; vertical-align: middle; width: 100%;"
>
<a
target="_blank"
href="https://pikwizard.com/photo/abstract-data-visualization-with-charts-overlay-on-dark-interface/aa79bd32e46dc9a98a50e94d3d0511de/"
style="text-decoration: none; font-size: 10px; margin: 0;"
>
<img src="https://pikwizard.com/pw/medium/aa79bd32e46dc9a98a50e94d3d0511de.jpg" style="margin: 0; width: 100%;" alt="" />
<p style="font-size: 12px; margin: 0;">PikWizard</p>
</a>
</span>
</span>
Free (free of charge)
Free for personal and commercial use.
Author: Authentic Images
Similar Free Stock Images

Premium


Premium


Premium


Premium


Premium


Premium


Premium


Premium

Premium

Premium


Premium

Premium


Premium


Premium


Premium


Premium


Premium


Premium


Premium


Premium


Premium


Premium


Premium


Premium

Premium

Explore More Free Stock Images