
- Home >
- Stock Photos >
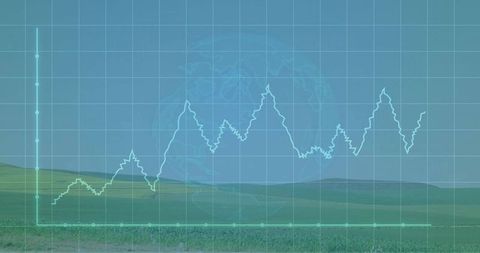
- Abstract Data Visualization with Dynamic Charts and Graphs
Abstract Data Visualization with Dynamic Charts and Graphs Image

Dynamic and engaging visual of data processing with abstract charts and graphs presented against a white background. Perfect for illustrating concepts in digital analytics, global business, stock market trends, and information technology. This image can be used in presentations, reports, or articles related to contemporary data analysis.
Powered by 


downloads
Tags:
More
Credit Photo
If you would like to credit the Photo, here are some ways you can do so
Text Link
photo Link
<span class="text-link">
<span>
<a target="_blank" href=https://pikwizard.com/photo/abstract-data-visualization-with-dynamic-charts-and-graphs/b1aac7c9b7da9325a2cd62626365ae27/>PikWizard</a>
</span>
</span>
<span class="image-link">
<span
style="margin: 0 0 20px 0; display: inline-block; vertical-align: middle; width: 100%;"
>
<a
target="_blank"
href="https://pikwizard.com/photo/abstract-data-visualization-with-dynamic-charts-and-graphs/b1aac7c9b7da9325a2cd62626365ae27/"
style="text-decoration: none; font-size: 10px; margin: 0;"
>
<img src="https://pikwizard.com/pw/medium/b1aac7c9b7da9325a2cd62626365ae27.jpg" style="margin: 0; width: 100%;" alt="" />
<p style="font-size: 12px; margin: 0;">PikWizard</p>
</a>
</span>
</span>
Free (free of charge)
Free for personal and commercial use.
Author: Creative Art
Similar Free Stock Images

Premium


Premium


Premium


Premium


Premium


Premium


Premium

Premium

Premium


Premium


Premium

Premium


Premium


Premium


Premium

Premium


Premium


Premium


Premium


Premium

Premium

Premium


Premium


Premium

Premium


Explore More Free Stock Images