
- Home >
- Stock Photos >
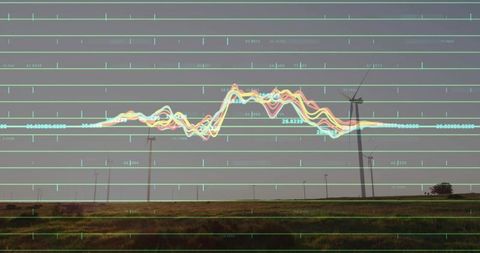
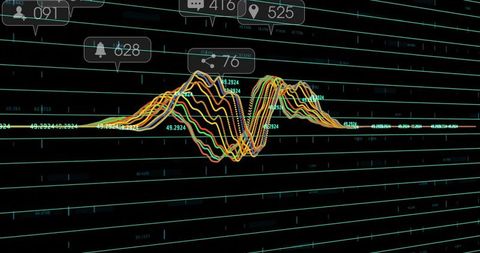
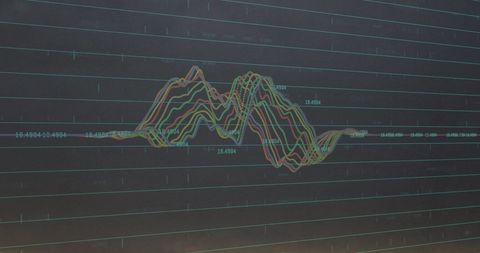
- Abstract Data Visualization with Dynamic Line Charts on Dark Background
Abstract Data Visualization with Dynamic Line Charts on Dark Background Image

Depicting complex line charts set against a dark background, this abstract concept represents global technology and data processing themes. Ideal for use in presentations related to data analytics, computing, or financial markets, the visualization suggests innovation and digital transformation in modern business environments.
Powered by  - Get 15% off with code: PIKWIZARD15


downloads
Tags:
More
Credit Photo
If you would like to credit the Photo, here are some ways you can do so
Text Link
photo Link
<span class="text-link">
<span>
<a target="_blank" href=https://pikwizard.com/photo/abstract-data-visualization-with-dynamic-line-charts-on-dark-background/e176876871977f45fb2e8a6431e81727/>PikWizard</a>
</span>
</span>
<span class="image-link">
<span
style="margin: 0 0 20px 0; display: inline-block; vertical-align: middle; width: 100%;"
>
<a
target="_blank"
href="https://pikwizard.com/photo/abstract-data-visualization-with-dynamic-line-charts-on-dark-background/e176876871977f45fb2e8a6431e81727/"
style="text-decoration: none; font-size: 10px; margin: 0;"
>
<img src="https://pikwizard.com/pw/medium/e176876871977f45fb2e8a6431e81727.jpg" style="margin: 0; width: 100%;" alt="" />
<p style="font-size: 12px; margin: 0;">PikWizard</p>
</a>
</span>
</span>
Free (free of charge)
Free for personal and commercial use.
Author: Awesome Content
Similar Free Stock Images

Premium


Premium


Premium


Premium

Premium


Premium


Premium

Premium


Premium


Premium

Premium


Premium


Premium


Premium


Premium


Premium

Premium


Premium

Premium

Premium

Premium


Premium


Premium


Premium


Premium

Explore More Free Stock Images