1. Home > 
  2. Stock Photos > 
  3. Abstract Data Visualization with Geometric Bar Graphics

Abstract Data Visualization with Geometric Bar Graphics Image

Abstract Data Visualization with Geometric Bar Graphics

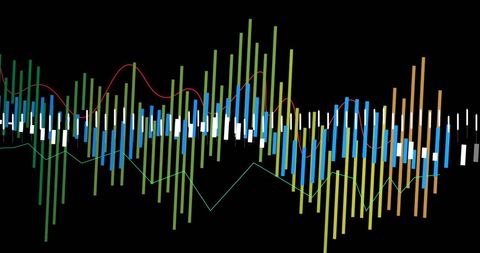
Abstract and colorful digital bars and lines depict complex data processing on a black background. The design is modern, emphasizing themes like data analytics, technological advancement, and global connectivity. Suitable for use in digital presentations, technology-related publications, or illustrating concepts in data science and computer programming.

Powered by Adobe logo
Standing woman wearing bright pink sleeveless top showing braided hair in studio, with data charts - Powered by AdobeA dark blue background with glowing data visualization graphics of graphs and charts. The focus is on the holographic appearance of digital bar graphs, - Powered by AdobeAbstract Colorful Bars Displaying Growth and Progress in a Digital Artistic Style with a Gradient Background for Modern Visual Concepts - Powered by AdobeA golden, glittering bar graph shows upward trend, with an arrow made of sparkling particles pointing up against a black backdrop - Powered by AdobeFuturistic financial data visualization with glowing blue line graphs and vertical bar chart, Abstract financial chart with rising graphs - Powered by Adobe

Credit Photo

If you would like to credit the Photo, here are some ways you can do so

Free (free of charge)

Free for personal and commercial use.

Author: People Creations

Similar Free Stock Images

Financial Data Display with Dynamic Digital Graph
Premium
Stack of coins with holographic financial chart and upward arrow on dark background
Tech Growth Analysis with Dynamic Data Visualization
Colorful Financial Graph with Digital Technology Concept
Upward Stock Market Arrow with Binary Code Background
Global Finance and COVID-19 Impact Representation
Digital Interface Concept with Graphs and Media Icons
Premium
A futuristic graphic showing ascending bar charts in vibrant colors, representing growth and data visualization in a digital environment.
Dynamic Stock Market Data on Digital Interface
Dynamic Stock Market Graph Displaying Surging Growth
Cityscape with Digital Stock Market Graphs and Statistics
Premium
Glowing blue bar chart with ascending vertical lines and dotted trend line on dark background, representing data growth, progress, and financial or technological advancement
Futuristic Digital Data Analytics Interface Display
Analyzing Financial Data on Digital World Map Background
Financial Data Visualization with Cityscape Overlay
Abstract Financial Graph On Black Background Representing Data Analysis
Premium
The illustration showcases a dynamic stock market background featuring financial charts and bar graphs, symbolizing business growth
Digital Data and Financial Charts on White Background
Financial Data Processing Visualization with Colorful Bar Charts
Dynamic Stock Market Graphs Over Digital Interface
Abstract Data Visualization Digital Chart Background
Premium
Abstract representation of rising growth with colorful bar graphs on a gradient background showcasing business success and financial increase concept
Financial Data Analysis Displayed on Server Infrastructure
Digital Simulated Global Financial Data and Graphs
Real-Time Financial Data Analysis with Graphs and Charts
Abstract Sound Waves on Dark Background
Premium
Financial growth chart emerging from smartphone with coins and digital particles
Premium
New Year celebration with colorful bar chart and clock  Happy New Year
Global Stock Market Data Visualization on Digital Map Background
Abstract Data Graph with Dynamic Charts and Indicators
Colorful Digital Waveform Represents Global Connections
Dynamic Financial Graph Visualizing Market Trends
3D Financial Market Analysis with Declining Stock Graph
Abstract Digital Financial Chart on Blue Interface
Dynamic Financial Data on Digital Screen
Abstract Digital Financial Data Chart with Pink Line Oscillations
Dynamic Financial Graphs Overlaying Modern Cityscape
Premium
Blue bar graph with upward trend
Futuristic Digital Data Analysis Visual with Line Graphs
Premium
Business data visualization and analysis on a laptop with graphs and charts
Financial Chart Analysis with Digital Grid Interface
Dynamic Data Visualization and Financial Growth Curves
Financial Data Visualization on Blue Background
Colorful Bar Graph with Data Overlay on Black Background
Premium
Abstract 3D Bar Chart Data Visualization with Orange and Green Bars image photo
Colorful Waveforms on Blue Background
Abstract Digital Chart on Black Background Representing Data Analysis
Fluctuating Digital Stock Market Data Chart
Dynamic Digital Soundwave Pattern on Dark Background
Premium
Discussing clinician patient in scrubs gown viewing data in clinic with bar chart ECG stethoscope
Financial Data Analysis with Declining Trends
Abstract Financial Data Analysis on Black Background
Financial Data with Molecular Background Concept
Data Analysis Graphics on Digital Grid Background
Abstract Neon Waves on Dark Background Concept
Colorful Bar Graph on Dark Background Illustrates Data Trends
Falling Line Graph on Navy Background Illustrating Economic Decline
Economic and Political Factors Influence Investment Trends
Dynamic Financial Graph on Digital Background
Premium
A red arrow shows a continuous upward trend over an orange bar chart symbolizing positive business growth and financial success
Digital Data Network with Dynamic Connections
Dynamic Financial Data Visualization with Blue Trends
Financial Data Analysis with Code Interface on Black Background
Abstract Digital Financial Chart on Blue Background
Premium
abstract colorful bar graph showing business growth and financial success with data analysis and market trends for corporate presentation and website
Premium
Collection of various colorful data visualization charts and graphs isolated on white background
Premium
A colorful abstract data visualization featuring concentric rings of vertical bars in a spectrum of vibrant hues
Financial Data Analyzing with Blue Digital Interface Background
Binary Code Data Over Financial Graph with Red Trends
Abstract Financial Chart Overlay with Sporadic White Lines
Abstract Data Visualization on Blue Background for Technology Concept
Premium
Abstract digital financial market data visualization with glowing bars and lines in blue and orange colors against a dark background
Digital Graph with Rising and Falling Lines on Grid Background
Financial Data Processing Visualization with Green Digital Grid
Data Analytics and Financial Growth Indicators
Digital Stock Market Display with Data Analysis Graphics
Premium
Four ascending, glowing bar graphs with vibrant neon outlines on a dark surface
Financial Data Analysis with Dynamic Graph on Blue Background
Dynamic Stock Market Data on Black Background
Digital Financial Data Visualization with Bar Graphs and Line Charts
Vibrant Financial Data Analysis on Black Background
Premium
A dark blue background with glowing data visualization graphics of graphs and charts. The focus is on the holographic appearance of digital bar graphs,
Data Trends and Analysis on 3D Digital Grid
Financial Graph Analysis on Green Grid Background
Abstract Data Visualization with Dynamic Charts and Graphs
Dynamic Bar Graph Display of Financial Data Trends
Premium
3d pie chart and bar graph on blue background with white graphics elements
Colorful Data Visualization on Dark Background
Dynamic Stock Market Chart Showing Fluctuating Financial Data
Dynamic Data Waves on Digital Grid
Dynamic Financial Fluctuation on Digital Graph
Premium
Cloud storage folder with data visualization and glowing bars representing digital backup
Graph Lines Portraying Financial Data Trends
Data Visualization on Security Shield Interface for Cyber Security
Financial Data Analysis Vibrant Graphs on Blue Background
Futuristic Data Processing Animation with Media Icons
Abstract Financial Chart Technology Interface
Abstract Financial Graph Illustration on Dark Background
Digital Analysis of Financial Data with Dynamic Graphs
Financial Data Analysis on Blue Digital Interface
Dynamic Stock Market Graph with ECO Icons
Dynamic Financial Data Chart Showing Trend Analysis
Digital Graphs Representing Data and Analytics on Black Background
Financial Data Overlay on Cityscape Visualizing Market Trends
Abstract Digital Data Graph and Diagrams on Gray Background
Premium
Colorful abstract illustration showing data represented as 3D bars, curves, and floating spheres
Dynamic Financial Data Display with Market Trends
Digital Data Stream and Holographic Analysis Visualization
Abstract Financial Data Visualization with Graphs
Stagflation Concept with Digital Graphs and Data Patterns
Premium
Abstract blue 3D bar chart with glowing line graph shows market growth. Digital data visualization indicates positive trend. Financial analysis graphic with bokeh.
Abstract Digital Data Network with Graphs and Symbols
NFT Financial Data Visualization with Digital Graph Overlay
Dynamic Financial Data Visualizations on Grid Interface
Dynamic Data Graphs Display on Dark Digital Background
Premium
A hand presenting a virtual bar chart illustrates increasing growth with digital lines and a futuristic backdrop, symbolizing financial success and analytics. Copula
Premium
Vibrant 3D pie chart placed on financial documents with bar and line graphs, representing data analysis, reporting and business performance metrics.
Abstract Financial Data Charts Reflecting Economic Trends
Digital Financial Data Overlaying City Skyline at Dusk
Data Security with Tech Bar Graph Overlay
Abstract Financial Graph with Bar and Line Charts on Dark Background
Dynamic Financial Data Bars on Black Background
Dynamic Digital Financial Data Chart Visualization
Dynamic Financial Data Graph on Blue Digital Background
Premium
Vibrant digital bar chart illustration showcasing positive business growth, financial progress, and data visualization for impactful presentations and reports
Explore More Free Stock Images