
- Home >
- Stock Photos >
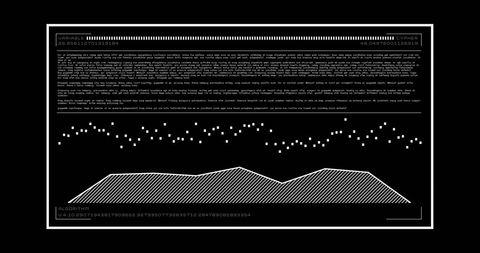
- Abstract Data Visualization with Graphs and Pie Chart Illustration
Abstract Data Visualization with Graphs and Pie Chart Illustration Image

Illustrates data processing using abstract graphs and pie charts set against a blue backdrop. Ideal for presentations on analytics, reports on economic trends, or content related to digital data management.
Powered by  - Get 15% off with code: PIKWIZARD15


downloads
Tags:
More
Credit Photo
If you would like to credit the Photo, here are some ways you can do so
Text Link
photo Link
<span class="text-link">
<span>
<a target="_blank" href=https://pikwizard.com/photo/abstract-data-visualization-with-graphs-and-pie-chart-illustration/eed2027bcdd9c15886101056d518dab9/>PikWizard</a>
</span>
</span>
<span class="image-link">
<span
style="margin: 0 0 20px 0; display: inline-block; vertical-align: middle; width: 100%;"
>
<a
target="_blank"
href="https://pikwizard.com/photo/abstract-data-visualization-with-graphs-and-pie-chart-illustration/eed2027bcdd9c15886101056d518dab9/"
style="text-decoration: none; font-size: 10px; margin: 0;"
>
<img src="https://pikwizard.com/pw/medium/eed2027bcdd9c15886101056d518dab9.jpg" style="margin: 0; width: 100%;" alt="" />
<p style="font-size: 12px; margin: 0;">PikWizard</p>
</a>
</span>
</span>
Free (free of charge)
Free for personal and commercial use.
Author: Creative Art
Similar Free Stock Images
Premium


Premium

Premium


Premium

Premium


Premium


Premium


Premium


Premium


Premium

Premium


Premium


Premium


Premium


Premium

Premium


Premium

Premium


Premium

Premium


Premium

Premium


Premium


Premium

Premium


Explore More Free Stock Images