
- Home >
- Stock Photos >
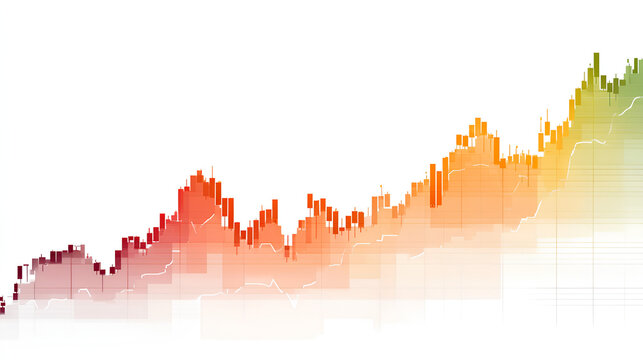
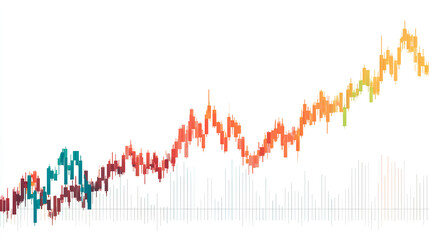
- Abstract Data Visualization with Graphs on Purple Background
Abstract Data Visualization with Graphs on Purple Background Image

Modern abstract depiction of data trends featuring white bar graphs and line charts on a sleek purple gradient background. Suitable for presentations on global business strategies, finance forecast reports, and digital data analysis tools. Use as a creative illustration in publications related to analytic techniques or economic growth studies.
Powered by 


downloads
Tags:
More
Credit Photo
If you would like to credit the Photo, here are some ways you can do so
Text Link
photo Link
<span class="text-link">
<span>
<a target="_blank" href=https://pikwizard.com/photo/abstract-data-visualization-with-graphs-on-purple-background/4a4674758a9d75a7a47b60eab47f6b3a/>PikWizard</a>
</span>
</span>
<span class="image-link">
<span
style="margin: 0 0 20px 0; display: inline-block; vertical-align: middle; width: 100%;"
>
<a
target="_blank"
href="https://pikwizard.com/photo/abstract-data-visualization-with-graphs-on-purple-background/4a4674758a9d75a7a47b60eab47f6b3a/"
style="text-decoration: none; font-size: 10px; margin: 0;"
>
<img src="https://pikwizard.com/pw/medium/4a4674758a9d75a7a47b60eab47f6b3a.jpg" style="margin: 0; width: 100%;" alt="" />
<p style="font-size: 12px; margin: 0;">PikWizard</p>
</a>
</span>
</span>
Free (free of charge)
Free for personal and commercial use.
Author: Creative Art
Similar Free Stock Images

Premium


Premium

Premium


Premium


Premium

Premium

Premium


Premium


Premium


Premium


Premium

Premium

Premium


Premium


Premium

AI


Premium

Premium


Premium


Premium


Premium


Premium


Premium


Premium


Premium

Premium

Explore More Free Stock Images