- Home >
- Stock Photos >
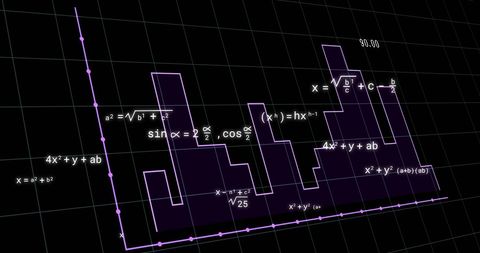
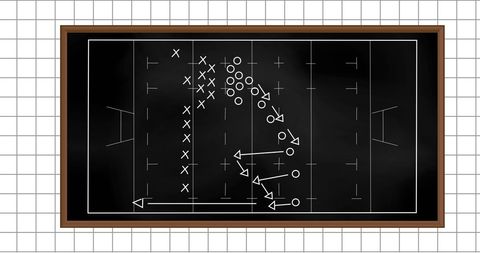
- Abstract Data Visualization with Grid and Data Points
Abstract Data Visualization with Grid and Data Points Image

Stylized image emphasizing concepts of data visualization and analytics. Dark gradient background features grid layout with alternating dark and bright blocks, intersected by quantified data points and connecting lines implying statistical trend displays. Ideal for illustrating technology concepts like data analysis, scientific computation, statistical method demonstrations, intelligence platforms, and research presentations.

downloads
Tags:
More
Credit Photo
If you would like to credit the Photo, here are some ways you can do so
Text Link
photo Link
<span class="text-link">
<span>
<a target="_blank" href=https://pikwizard.com/photo/abstract-data-visualization-with-grid-and-data-points/1852f9c322c4ea7a402913ea5c657732/>PikWizard</a>
</span>
</span>
<span class="image-link">
<span
style="margin: 0 0 20px 0; display: inline-block; vertical-align: middle; width: 100%;"
>
<a
target="_blank"
href="https://pikwizard.com/photo/abstract-data-visualization-with-grid-and-data-points/1852f9c322c4ea7a402913ea5c657732/"
style="text-decoration: none; font-size: 10px; margin: 0;"
>
<img src="https://pikwizard.com/pw/medium/1852f9c322c4ea7a402913ea5c657732.jpg" style="margin: 0; width: 100%;" alt="" />
<p style="font-size: 12px; margin: 0;">PikWizard</p>
</a>
</span>
</span>
Free (free of charge)
Free for personal and commercial use.
Author: Creative Art