
- Home >
- Stock Photos >
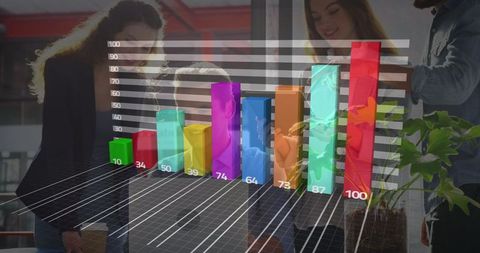
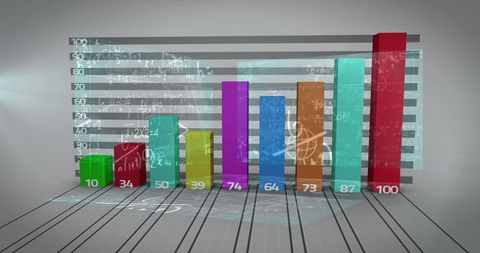
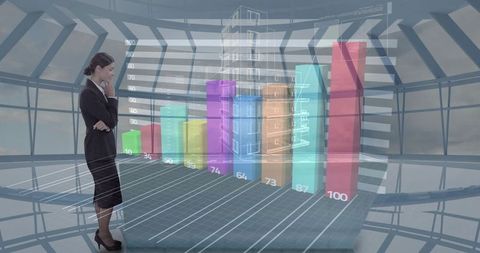
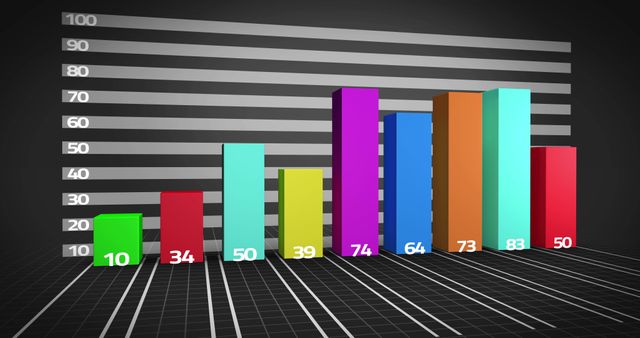
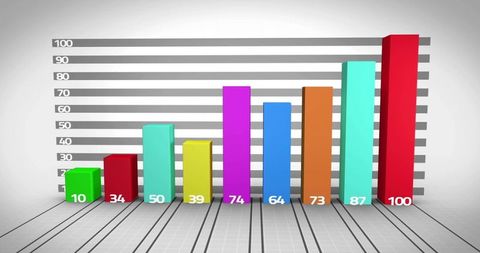
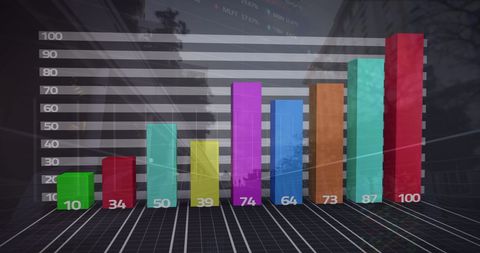
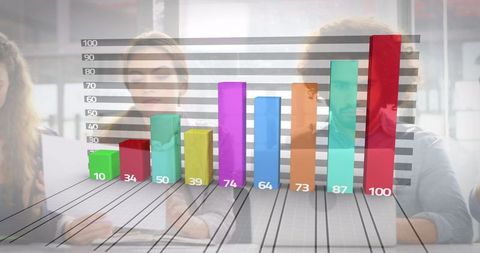
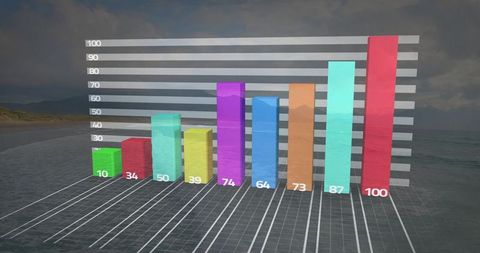
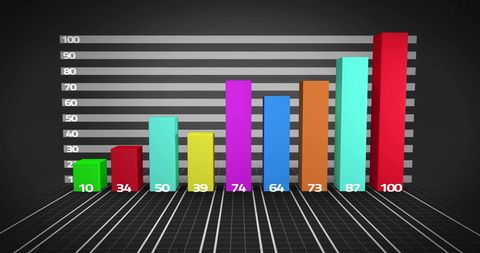
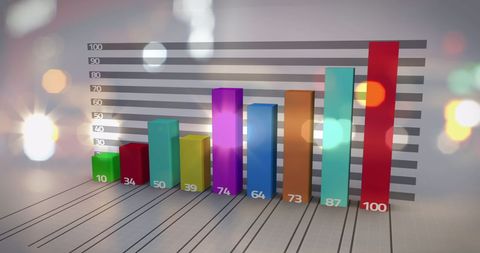
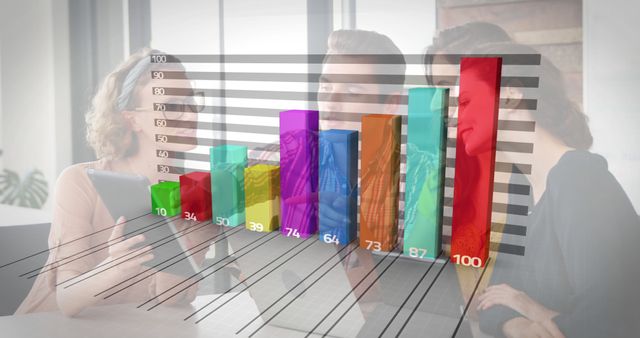
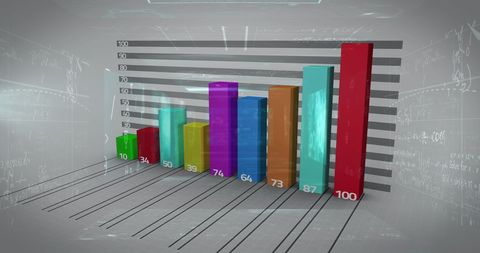
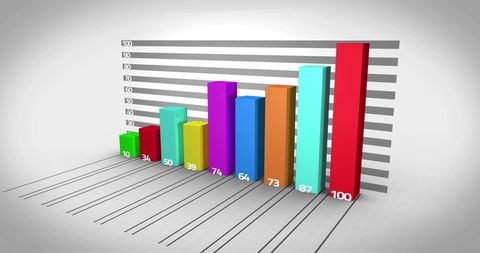
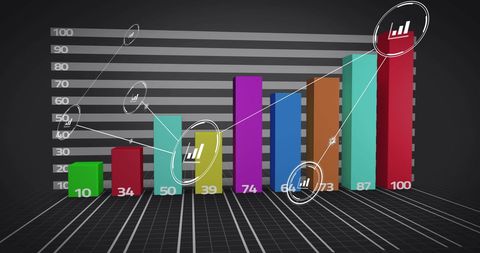
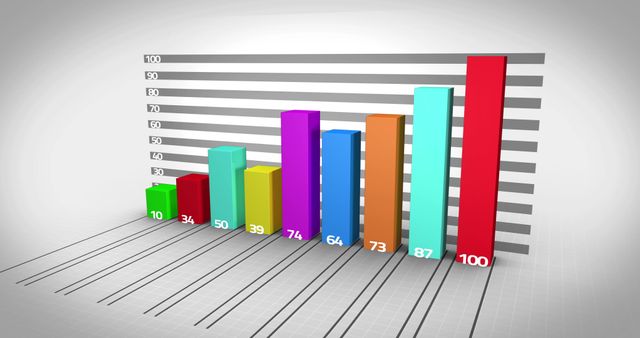
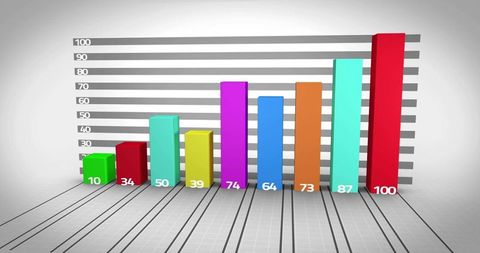
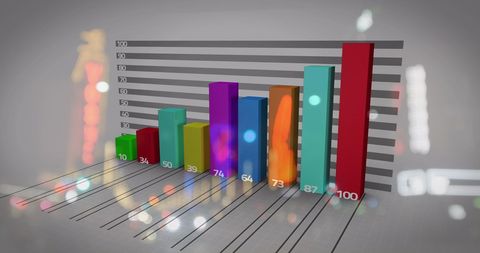
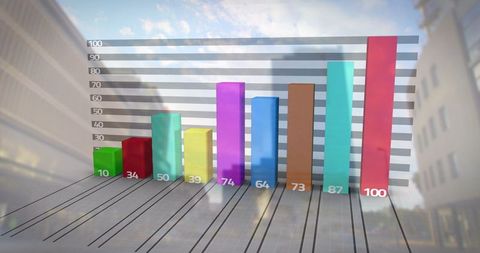
- Abstract Data Visualization with Measurement Transparency
Abstract Data Visualization with Measurement Transparency Image
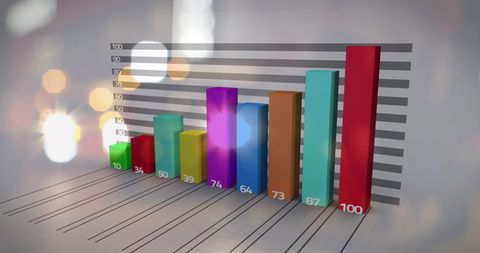
Illustrates transparent lights overlaying colorful bar graphs, merging classic statistical representation with contemporary design. Suitable for illustrating technology and data analytics themes, presentations on business growth, or showcasing modern statistical processing techniques in visual media.
Powered by 


downloads
Tags:
More
Credit Photo
If you would like to credit the Photo, here are some ways you can do so
Text Link
photo Link
<span class="text-link">
<span>
<a target="_blank" href=https://pikwizard.com/photo/abstract-data-visualization-with-measurement-transparency/509fe1734e343a8ccf1bfd3b0c721435/>PikWizard</a>
</span>
</span>
<span class="image-link">
<span
style="margin: 0 0 20px 0; display: inline-block; vertical-align: middle; width: 100%;"
>
<a
target="_blank"
href="https://pikwizard.com/photo/abstract-data-visualization-with-measurement-transparency/509fe1734e343a8ccf1bfd3b0c721435/"
style="text-decoration: none; font-size: 10px; margin: 0;"
>
<img src="https://pikwizard.com/pw/medium/509fe1734e343a8ccf1bfd3b0c721435.jpg" style="margin: 0; width: 100%;" alt="" />
<p style="font-size: 12px; margin: 0;">PikWizard</p>
</a>
</span>
</span>
Free (free of charge)
Free for personal and commercial use.
Author: Awesome Content
Similar Free Stock Images


Premium


Premium

AI


Premium


Premium


Premium

AI


Premium


Premium

Premium


Premium


Premium


Premium


Premium

AI


Premium


AI

Premium


Premium


Premium

Premium

Premium


Premium


Premium


Premium


Premium


Premium

Premium


AI

Premium


Explore More Free Stock Images